
SLIDE 1
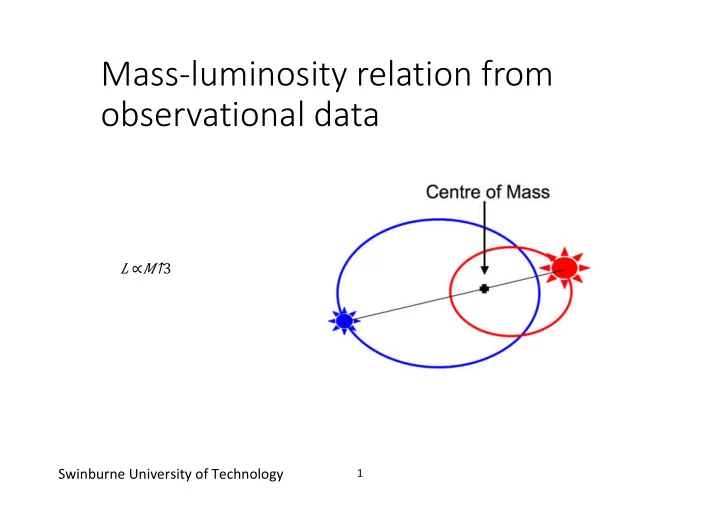
Mass-luminosity relation from
- bservational data
𝑀 ∝𝑁↑3 Swinburne University of Technology
1
3 Swinburne University of Technology 1 Mass-luminosity relation - - PowerPoint PPT Presentation
Mass-luminosity relation from observational data 3 Swinburne University of Technology 1 Mass-luminosity relation from observational data 3 Log L/L Log M/M 2 Hertzsprung- Russel diagram
𝑀 ∝𝑁↑3 Swinburne University of Technology
1
𝑀 ∝𝑁↑3
2
ESO
3
𝑀 ∝𝑈↓eff↑6
𝑀 ∝𝑈↓eff↑6 ESO
4
𝜐 ∝𝑁↑−2 ESO
5
6
Adam Block
7
8