
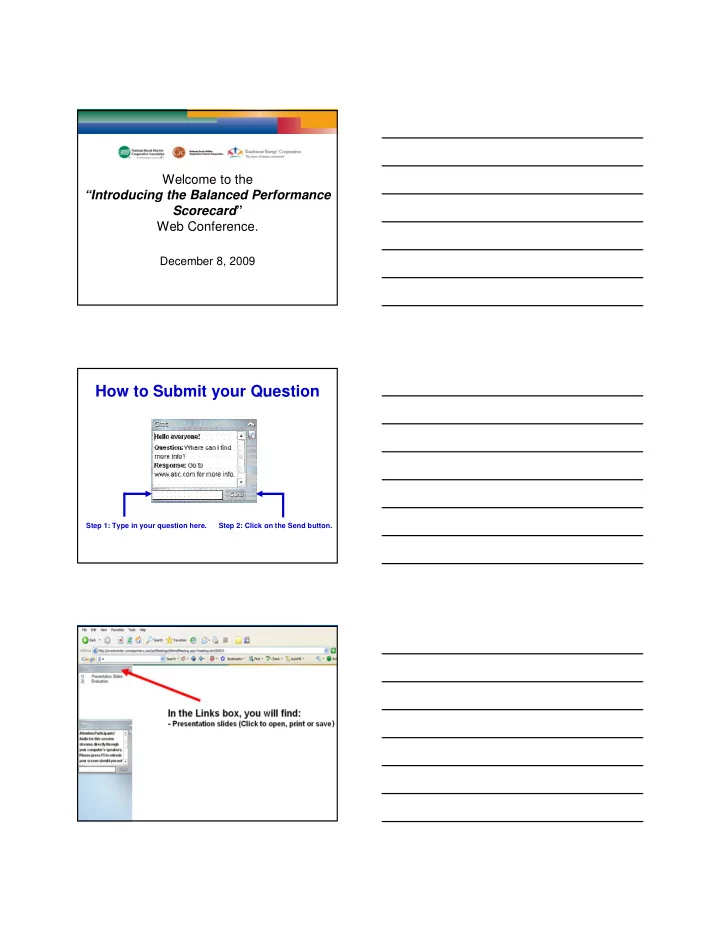
SLIDE 1
Welcome to the “Introducing the Balanced Performance Scorecard” Web Conference.
December 8, 2009
How to Submit your Question
Step 2: Click on the Send button. Step 1: Type in your question here.
How to Submit your Question Step 1: Type in your question here. - - PDF document
Welcome to the Introducing the Balanced Performance Scorecard Web Conference. December 8, 2009 How to Submit your Question Step 1: Type in your question here. Step 2: Click on the Send button. Tim Sullivan Director, C&I Business
Welcome to the “Introducing the Balanced Performance Scorecard” Web Conference.
December 8, 2009
Step 2: Click on the Send button. Step 1: Type in your question here.
Tim Sullivan Director, C&I Business Development, NRECA
Scorecard and how it can help.
Scorecard website on Cooperative.com.
a Balanced Performance Scorecard.
Are you familiar with Balanced Performance Scorecards?
Are We Achieving Our Mission?
A Situation Overview
exist to provide safe, reliable, affordable energy to the satisfaction of our members.
measure their performance in reliability, safety, cost control and member satisfaction.
compare/benchmark their performance against their goals, peers, competitors, or other industries.
many best-in-class systems already use some form
8
The Goal: Realize Our Mission
benchmarks, electric cooperatives may underperform
tools, and benchmarks, they often do not know where
from fully achieving their mission.
electric cooperatives, the situation can be improved…and we can better realize our mission.
9
The Balanced Performance Scorecard
CFC to develop:
– A standardized set of metrics to measure reliability, safety, cost control, and member satisfaction for electric cooperatives. – A standardized Balanced Performance Dashboard, which will help system’s compare performance against goals and peers. – An on-line database where reliability, safety, cost control and member satisfaction information can be easily accessed and obtained.
10
Proposed Metrics – Balanced View
Cooperative Mission Cooperative Mission All Injury Incident Rate Days Away Incident Rate Severity Incident Rate (OSHA reporting standards) Safety American Customer Satisfaction Index (ACSI) Member Satisfaction Cost per KWH Sold Percent Change Total Investment per Mile of Line Percent Change Total Controllable Expenses Per Consumer Cost System Average Interruption Duration Index (SAIDI) * System Average Interruption Frequency Index (SAIFI) Customer Average Interruption Duration Index (CAIDI) * With and without major event days and power supply interruptions Reliability
11
group of seven CEOs, including several current scorecard users.
recommendations on individual metrics and on Dashboard formats.
by quartile, peer group, and trend.
16 36 57 66 71 86 11 10 20 30 40 50 60 70 80 90 74 and below 75-78 79-81 82-83 84-85 86-89 90 and Over
Number of Cooperatives
Touchstone Energy Cooperatives - Distribution of ACSI Scores, Year 2008
Descriptives:
N = 343 High = 91 Low = 53 Mean = 82.72
4.68
benchmark information available.
information and compare more closely with peers.
NRECA
Page 21
Critical Performing Area: Reliability “Distribution system reliability is among the top issues facing cooperatives today” Performance Measures:
Average Interruptible Duration Index (SAIDI)
Average Interruptible Frequency Index (SAIFI)
Average Interruptible Duration Index (CAIDI)
Reliability:
IEEE Guideline: “Collecting, Categorizing, and Utilization of Information to Electric Power Distribution Interruption Events”
Applies a statistical methodology to determine major event days Applies a consistent means for reporting and comparing reliability performance results (RUS Form 7 – SAIDI)
a Cooperative Reliability Benchmarking Group
Reliability benchmarking is emerging as a vitally important tool to capture and communicate the competitiveness of cooperatives. For more information on participating on NRECA’s Reliability Benchmarking Group, contact Alvin Razon (alvin.razon@nreca.coop)
Page 22 Page 23
Reliability Benchmark Results:
Improving Reliability Results – Key Points:
Page 24
Critical Performing Area: Safety “Studies show there is a direct correlation between safety performance and
Performance Measures:
recordable injuries reported per 100 employees
OSHA recordable injuries resulting in lost work days, transfers, or restrictive duty per 100 employees
lost per OSHA recordable injuries
Measuring Safety Performance
Days Away Incident Rate are computed by normalizing for 100 employees or 200,000 man-hours as follows:
OSHA Recordable Injuries X 200,000 / Actual Man-Hours Worked
understand total performance
correlates to the number of unsafe behaviors and/or conditions occurring within the same time period. The rates can be viewed as an injury risk factor for employees
term results
Page 25 Page 26
Safety
All Injury Incident Rate Days Away Incident Rate Severity Rate
Safety Benchmark Results (based on Rural Electric Safety Accreditation Program) Improving Safety Performance – Key Points Organization leaders own the culture that drives safety performance. Organization leaders take ownership for safety outcomes and the system, conditions, and processes that create those results. Sustainable safety improvement is achieved by engaging and motivating employees to actively participate in safety systems. Safety systems focus on reducing exposure to injuries by increasing safe behaviors and reducing unsafe acts. Safety must be a core value within the organization.
Page 27
Critical Performing Area: Cost “Today’s cost pressures require cooperatives to examine all aspects of their cost structure in order to maximize efficiency and effectiveness” Performance Measures:
measures the average effective rate
Controllable Cost per Consumer: measures the rate of change in controllable cost
Plant Investment per Mile of Line: measures the rate of change in the investment in plant
Measuring Cost Performance
balanced sound cost control business practice and investments to achieve strategic objectives
required to effective manage cost and investments to achieve overall value for the membership
change for trends, performance comparisons, and related analysis for improvement
Page 28 Page 29
Benchmarking Cost Performance (based on CFC KRTA data):
Improving Cost Performance – Key Points: Analyze the underlying factors impacting cost performance Establish process study teams to identify ways to improve resource efficiencies and minimize waste (non-value added activities) throughout the
Seek an optimization approach: balance cost control objectives while meeting service and operating performance goals.
Performance Scorecard
Page 30
Page 31
Six-Step Process for Improving Performance Results Summary
cooperatives with primary emphasis on measuring, understanding and improving the critical performance areas of our mission.
with related strategic initiatives
Incentives may drive behaviors in one area at the expense of another. Incentives require careful alignment to provide any meaningful improvement. The Balanced Scorecard should be used to challenge and motivate teams to improve performance for sake of all stakeholders.
your current performance.
Meaningful improvement begins by having intimate knowledge of current performance.
Page 32
− − − − "#
− $$ −
$
& &
Goals Results Performance Category Critical Success Factors Key Indicators KPI Weight Base (2%) Target (3%) Stretch (5%) Current Quarter Year to Date MEMBER SERVICE Reliability Customer Satisfaction SAIDI (minutes) Quarterly Index Survey 20.0% 20.0% 140 min. 9.0 130 min. 9.1 120 min. 9.2 15.4 min. 9.0 70.4 min. 9.0 FINANCIAL PERFORMANCE Total Operating Expenses Cash Flow Cents per kWh Cash Flow % of Investment 15.0% 10.0% 4.03¢ 75% 3.99¢ 80% 3.95¢ 85% 4.54¢ 52% 4.23¢ 96% INTERNAL PROCESSES Safety Safety Index 20.0% 4.6 3.6 2.6 1.2 2.6 INNOVATION AND LEARNING Member Value Efficiency and Effectiveness Electric Revenue per kWh sold Total Margins / # of Employees 10.0% 5.0% Budget $34,400
state median $37,200
state median $40,000 higher than adj. budget by .10¢ $4,244 13.3% below state median $18,844 Sum of Weights Assigned to KPIs 100.0% Notes: EMC must achieve a 1.25 operating TIER for performance awards to be paid. Goals are for EMC results, exclusive of the LLC.
#$&
"'&"()
− % − %*&+( #$, − ,,
−
*#
$%$
− *# − -%&"( .
%
− / %%$#.$. − 0&"( − #
' .". 11)
+.23$.45 " %$ ."$$ $# $6 $%$ $$# #( 6
Southside Electric Cooperative
Applying Performance Scorecard for Improvements
Jeff Edwards
– SEC is the largest rural electric cooperative in Virginia geographically – 53,227 active meters in portions of 18 counties, 6 towns and one city – 8,200 miles of line in South Central Virginia – 170 Employees
showed gaps in the critical performing areas:
– Customer Services – Safety – Reliability – Cost control
– Board and staff did not have a candid view of the true state of performance – We rationalize our low ASCI score because of our high rates
Past Performance & Culture (continued)
the underlying factors hindering performance
– Investing in technology that didn’t achieve desired benefits – Rising controllable spending – Rationalizing our safety performance
high risk industry
– Not doing in-depth analysis to find ways to improve reliability performance – Not providing the quality service for key member touch-points
How the performance scorecard helped:
– An opportunity to have candid discussion on our current performance – As we compared our results with other Cooperatives, Staff accepted the challenge of improving performance
– A means to engage the Board on our improvement plans – A template to monitor, track, and report our progress to employees
improvement process
causes and corrective actions for improvement
do to improve efficiency and cost
members on how we are getting better
plan integrated with construction work plan
and injuries
including reduction in vehicle fleet size
Based on what you’ve heard today, do you think you might implement a Balanced Performance Scorecard at your cooperative?
Step 2: Click on the Send button. Step 1: Type in your question here.