
Archimedes has developed a unique method of analysis of potential field data, Energy Spectral Analysis – Moving Window (ESA-MW). This is the principal method used in mapping geological horizons and trends from gridded magnetic and gravity data sets.
ARCHIMEDES | THEORY
HORIZON INTERPRETATION: ENERGY SPECTRAL ANALYSIS – MOVING WINDOW
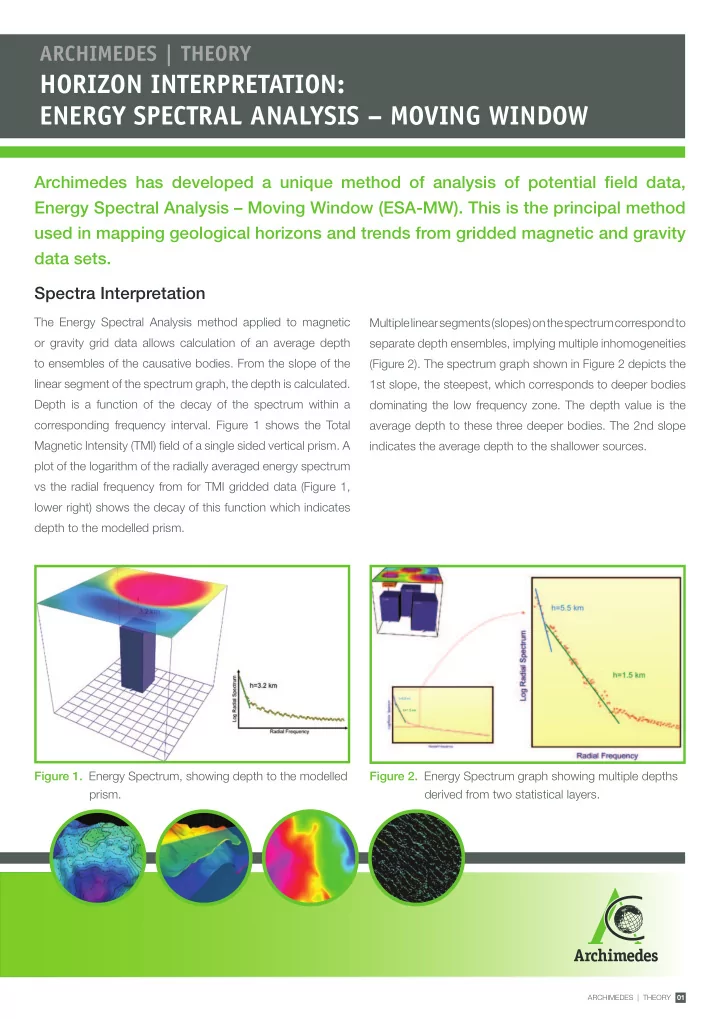
Figure 1. Energy Spectrum, showing depth to the modelled prism. Figure 2. Energy Spectrum graph showing multiple depths derived from two statistical layers.
ARCHIMEDES|THEORY01
Spectra Interpretation
The Energy Spectral Analysis method applied to magnetic
- r gravity grid data allows calculation of an average depth
to ensembles of the causative bodies. From the slope of the linear segment of the spectrum graph, the depth is calculated. Depth is a function of the decay of the spectrum within a corresponding frequency interval. Figure 1 shows the Total Magnetic Intensity (TMI) field of a single sided vertical prism. A plot of the logarithm of the radially averaged energy spectrum vs the radial frequency from for TMI gridded data (Figure 1, lower right) shows the decay of this function which indicates depth to the modelled prism. Multiple linear segments (slopes)
- n
the spectrum correspond to separate depth ensembles, implying multiple inhomogeneities (Figure 2). The spectrum graph shown in Figure 2 depicts the 1st slope, the steepest, which corresponds to deeper bodies dominating the low frequency zone. The depth value is the average depth to these three deeper bodies. The 2nd slope indicates the average depth to the shallower sources.