
SLIDE 1
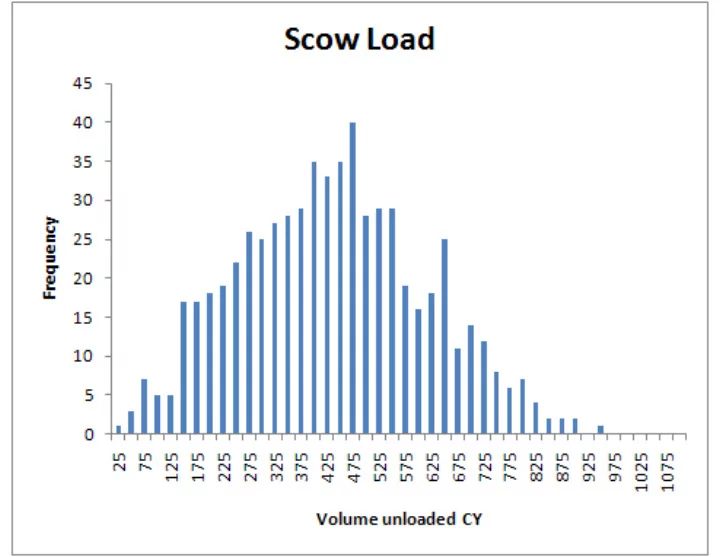
Histogram of Scow Removable Load Thickness Figure 5-2 April 2010 - - PowerPoint PPT Presentation
60 50 40 ws Number of Sco 30 20 10 0 0.1 0.2 0.3 0.4 0.5 0.6 0.7 0.8 0.9 1.0 1.1 1.2 1.3 1.4 1.5 1.6 1.7 1.8 1.9 2.0 2.1 2.2 2.3 2.4 2.5 2.6 2.7 2.8 2.9 3.0 3.1 3.2 3.3 3.4 3.5 3.7 Estimated Removable Load
60 50 40 ws 30 Number of Sco 20 10
0.1 0.2 0.3 0.4 0.5 0.6 0.7 0.8 0.9 1.0 1.1 1.2 1.3 1.4 1.5 1.6 1.7 1.8 1.9 2.0 2.1 2.2 2.3 2.4 2.5 2.6 2.7 2.8 2.9 3.0 3.1 3.2 3.3 3.4 3.5 3.7
Estimated Removable Load Thickness in Feet
April 2010
EPA Phase 1 Evaluation Report - Hudson River PCBs Site
Figure 5-2
Histogram of Scow Removable Load Thickness
Average Daily Bucket Fill Rate Sediment Losses Indicated when Bucket Fill Rates Approach or Exceed 100%
Average Daily Bucket Fill Rate CU 7 12 14 16 Average Daily Bucket Fill Rate CU-7
(CU‐7)
8 10 12 equency 4 6 Fre 20 40 60 80 100 120 140 160 180 2 Average Percent Full
140% 150%
Bucket Filling Efficiency (%)
DP1 DP2 DP3 DP4 DP5 181%
110% 120% 130% 140%
1 cy Bucket Size
70% 80% 90% 100%
1 cy 2 cy 5 cy
30% 40% 50% 60% 0% 10% 20% 30% 6/1 6/8 6/15 6/22 6/29 7/6 7/13 7/20 7/27 8/3 8/10 8/17 8/24 8/31 9/7 9/14 9/21 9/28 10/5 10/12 10/19 10/26
Note : DP = Dredge Pass
March 2010
EPA Phase 1 Evaluation Report - Hudson River PCBs Site
Figure III-3-3a
Average Daily Bucket Filling Efficiency
Bucket Filling
140% 150%
Bucket Filling Efficiency (%)
DP1 DP2 DP3 DP4
100% 110% 120% 130%
1 cy Bucket Size
70% 80% 90% 100%
2 cy 5 cy
40% 50% 60% 0% 10% 20% 30% 0% 6/1 6/8 6/15 6/22 6/29 7/6 7/13 7/20 7/27 8/3 8/10 8/17 8/24 8/31 9/7 9/14 9/21 9/28 10/5 10/12
Note : DP = Dredge Pass
March 2010
EPA Phase 1 Evaluation Report - Hudson River PCBs Site
Figure III-3-3b
Average Daily Bucket Filling Efficiency
140% 150%
Bucket Filling Efficiency (%)
DP1 DP2 DP3
110% 120% 130% 140%
1 cy 2 Bucket Size
DP2 3
70% 80% 90% 100%
2 cy 5 cy
40% 50% 60% 70% 0% 10% 20% 30% 7/6 7/13 7/20 7/27 8/3 8/10 8/17 8/24 8/31 9/7 9/14 9/21 9/28 10/5
Note : DP = Dredge Pass
March 2010
EPA Phase 1 Evaluation Report - Hudson River PCBs Site
Figure III-3-3c
Average Daily Bucket Filling Efficiency
140% 150%
Bucket Filling Efficiency (%)
DP1 DP2 DP3
Bucket Size
110% 120% 130% 140%
1 cy 2 cy 5 cy
70% 80% 90% 100% 40% 50% 60% 70% 0% 10% 20% 30% 0% 7/16 7/23 7/30 8/6 8/13 8/20 8/27 9/3 9/10 9/17 9/24 10/1 10/8 10/15 10/22
Note:DP=Dredge Pass
March 2010
EPA Phase 1 Evaluation Report - Hudson River PCBs Site
Figure III-3-3d
Average Daily Bucket Filling Efficiency
150%
Bucket Filling Efficiency (%)
DP1 DP2 DP3
110% 120% 130% 140% 70% 80% 90% 100% % 40% 50% 60% 70%
1 cy Bucket Size
0% 10% 20% 30%
2 cy 5 cy
0% 6/8 6/15 6/22 6/29 7/6 7/13 7/20 7/27 8/3 8/10 8/17 8/24 8/31 9/7 9/14
Note : DP = Dredge Pass
March 2010
EPA Phase 1 Evaluation Report - Hudson River PCBs Site
Figure III-3-3e
Average Daily Bucket Filling Efficiency
B k t Filli
140% 150%
Bucket Filling Efficiency (%)
DP1 DP2 DP3
1 cy Bucket Size
100% 110% 120% 130%
y 2 cy 5 cy
70% 80% 90% 100% 30% 40% 50% 60% 0% 10% 20% 30% 6/11 6/18 6/25 7/2 7/9 7/16 7/23 7/30 8/6 8/13 8/20 8/27 9/3 9/10 9/17 9/24
Note : DP = Dredge Pass
March 2010
EPA Phase 1 Evaluation Report - Hudson River PCBs Site
Average Daily Bucket Filling Efficiency
Figure III-3-3f
140% 150%
Bucket Filling Efficiency (%)
DP1 DP2 DP3 DP4 172%
110% 120% 130% 140% 70% 80% 90% 100% 40% 50% 60% 70%
1 cy Bucket Size
0% 10% 20% 30%
1 cy 2 cy 5 cy
0% 7/7 7/14 7/21 7/28 8/4 8/11 8/18 8/25 9/1 9/8 9/15 9/22 9/29 10/6 10/13
Note : DP = Dredge Pass
March 2010
EPA Phase 1 Evaluation Report - Hudson River PCBs Site
Figure III-3-3g
Average Daily Bucket Filling Efficiency
Bucket Filling
150%
Bucket Filling Efficiency (%)
DP1 DP2 DP3
1 cy
DP4
Bucket Size
110% 120% 130% 140%
1 cy 2 cy 5 cy
70% 80% 90% 100% 40% 50% 60% 70% 0% 10% 20% 30% 0% 7/19 7/26 8/2 8/9 8/16 8/23 8/30 9/6 9/13 9/20 9/27 10/4 10/11 10/18 10/25
Note : DP = Dredge Pass
March 2010
EPA Phase 1 Evaluation Report - Hudson River PCBs Site
Figure III-3-3h
Average Daily Bucket Filling Efficiency
140% 150%
Bucket Filling Efficiency (%)
DP1 DP2 DP3
Bucket Size
110% 120% 130% 140%
1 cy 2 cy 5 cy Bucket Size
70% 80% 90% 100%
5 cy
40% 50% 60% 70% 0% 10% 20% 30% 0% 6/26 7/3 7/10 7/17 7/24 7/31 8/7 8/14 8/21 8/28 9/4 9/11
Note : DP = Dredge Pass
March 2010
EPA Phase 1 Evaluation Report - Hudson River PCBs Site
Figure III-3-3i
Average Daily Bucket Filling Efficiency
Bucket Filling
140% 150%
Bucket Filling Efficiency (%)
DP1 DP2 DP3 182% 155%
Bucket Size
100% 110% 120% 130%
1 cy 2 cy (in SP) 5 cy (out SP)
70% 80% 90% 100% 30% 40% 50% 60% 0% 10% 20% 30% 6 3 6 3 7 3 7 4 1 8 5 2 7/16 7/23 7/30 8/6 8/13 8/20 8/27 9/3 9/10 9/17 9/24 10/ 10/ 10/1 10/22
Notes : DP = Dredge Pass SP = Sheet Pile
March 2010
EPA Phase 1 Evaluation Report - Hudson River PCBs Site
Figure III-3-3j
Average Daily Bucket Filling Efficiency
Figure 1-1 April 2010
EPA Phase 1 Evaluation Report – Hudson River PCBs Site
Bucket Bite Locations and Depths below 2005 Bathymetric Surface
18 4.5 Feet
Date
7/20/2009 7/21/2009 7/22/2009 7/23/2009 7/24/2009 7/25/2009 7/28/2009 7/29/2009 7/30/2009 7/31/2009 8/3/2009 8/5/2009 Dredging Area 1 Area of Interest
Variable Name Source Description BCntTotal GE Bucket_Analysis_Table_20091202.xlsx Bucket Count BargeDist vessel_tracking_20100107.txt Total distance traveled by barges per day BargeV_D Derived Daily average of the product of distance times velocity for barges BargeVel vessel_tracking_20100107.txt Daily Average velocity of barges DrdgDist vessel_tracking_20100107.txt Total distance traveled by drdges per day DrdgV_D Derived Daily average of the product of distance times velocity for dredges DrdgVel vessel_tracking_20100107.txt Average velocity of dredges Load_Bfill Tables 2.6‐5 through 14 of Phase 1 Data Compilation Report for open CU times, USGS for flow Product of number of CUs being backfilled times the flow FlowFE USGS Flow at the Ft. Edward flow gage Temp_C Temperature Load_CU_Area Form 1 Residual Cores Data Export , Tables 2.6‐ 5 through 14 of Phase 1 Data Compilation Report for open CU times, USGS for flow Product of open CU area times flow times average concentration in the CU MassRemTotal3 TPCB concentration at far‐field &USGS flow Total Mass Removed per day SbDist vessel_tracking_20100107.txt Total distance traveled by small boats per day SbV_D vessel_tracking_20100107.txt Daily average of the product of distance times velocity for small boats SbVel vessel_tracking_20100107.txt Average velocity of small boats ScowDist vessel_tracking_20100107.txt Total distance traveled by scows per day ScowV_D vessel_tracking_20100107.txt Daily average of the product of distance times velocity for scows ScowVel vessel_tracking_20100107.txt Average velocity of scows TotalBfill Tables 2.6‐5 through 14 of Phase 1 Data Compilation Report Number of CUs being backfilled per day VolRemTotal GE Weekly Report Total volume of sediment removed per day BoatDist vessel_tracking_20100107.txt Total distance traveled by all boats per day Table 8a. Variable Descriptions. Variables were summarized for each day on eacn CU as well as cumulatively across all CUs.
Variable Name Source Description BoatVel vessel_tracking_20100107.txt Daily average of the product of distance times velocity for all boats BoatV_D vessel_tracking_20100107.txt Average velocity of all boats LoadBoats vessel_tracking_20100107.txt Product of distance traveled by all boats and flow TotalEfficiency Garvey, GE Bucket_Analysis_Table_20091202.xlsx? Please define ME GE Bucket_Analysis_Table_20091202.xlsx Procuct of total mass removed and average daily efficiency ScowsOnQueue Derived
Average number of scows on queue per day. When scows are
queued, dredging contractors slow down and potentially nibble sediment, increasing the resuspension losses per unit sediment removed.
ME Derived
(Volume removed)/(bucket count x bucket volume) x (mass
removed). Index to spillage associated with resuspension due to failure to fully close buckets in efforts to increase removal
apparently over-full buckets due to volume associated with multiple actual cycles being associated with a single apparent cycle in the data.
TugMIlePCBs Derived
CU and non-CU specific concentration and water depth-
weighted tug distance. Previous analyses looked at total vessel distance per day, but these totals were correlated with total mass and volume removed. Separate CU-specific and concentration- and depth-specific information was needed in
mass and volume removal
TugMilePCBs_Bfill Derived
(Product of number of units being backfilled) x (metric
described in 4 - tug disturbance).
CuMass Derived
CU-specific mass of PCBs removed. By separating mass removed per CU specifically, it was possible to separate general removal effects from other factors.
LoadBoats Derived Product of distance traveled by all boats and flow tPCB_CU_AREA Derived Total surface PCB concentration in open CUs times area of the CU. Table 8b. Variable Descriptions. Variables were summarized for each day on eacn CU as well as cumulatively across all CUs.