
SLIDE 1
Alfvén eigenmodes (AE) degrade fast-ion confinement in high βN, steady-state scenarios
W.W. (Bill) Heidbrink1
with J. Ferron,2 C. Holcomb,3
- M. Van Zeeland2, E. Bass4, X.
Chen2, C. Collins1, A. Garofalo2, X. Gong5, N. Gorelenkov6, B. Grierson6, C. Petty2, M. Podestà6, D. Spong7,
- L. Stagner1, Y. Zhu1
1University of California, Irvine 2General Atomics 3Lawrence Livermore National
Laboratory
4University of California, San Diego 5Institute of Plasma Physics
Chinese Academy of Science
6Princeton Plasma Physics
Laboratory
7Oak Ridge National Laboratory
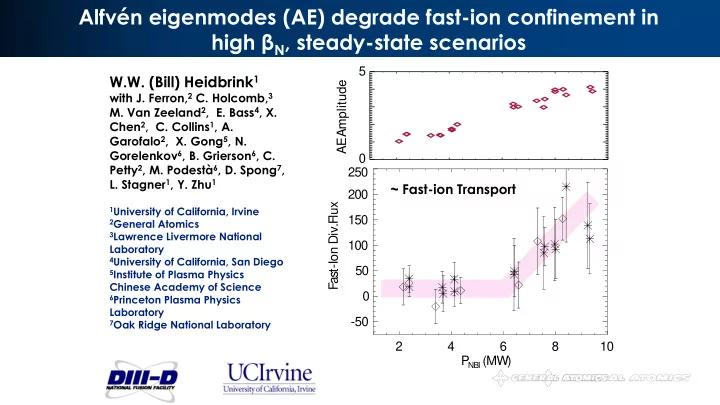
2 4 6 8 10 P
NBI (MW)
- 50
50 100 150 200 250 Fast-Ion Div.Flux AE Amplitude 5
~ Fast-ion Transport