HIGH CURRENT-CARRYING CAPACITY STUDY OF CNT ENHANCED COMPOSITES P. - - PDF document

high current carrying capacity study of cnt enhanced
SMART_READER_LITE
LIVE PREVIEW

HIGH CURRENT-CARRYING CAPACITY STUDY OF CNT ENHANCED COMPOSITES P. - - PDF document

THE HIGH CURRENT-CARRYING CAPACITY OF CNT ENHANCED COMPOSITES HIGH CURRENT-CARRYING CAPACITY STUDY OF CNT ENHANCED COMPOSITES P. Azamian, J. G. Park, Z. Liang*, Ben Wang and Chuck Zhang Department of Industrial and Manufacturing Engineering


slide-1
SLIDE 1

THE HIGH CURRENT-CARRYING CAPACITY OF CNT ENHANCED COMPOSITES

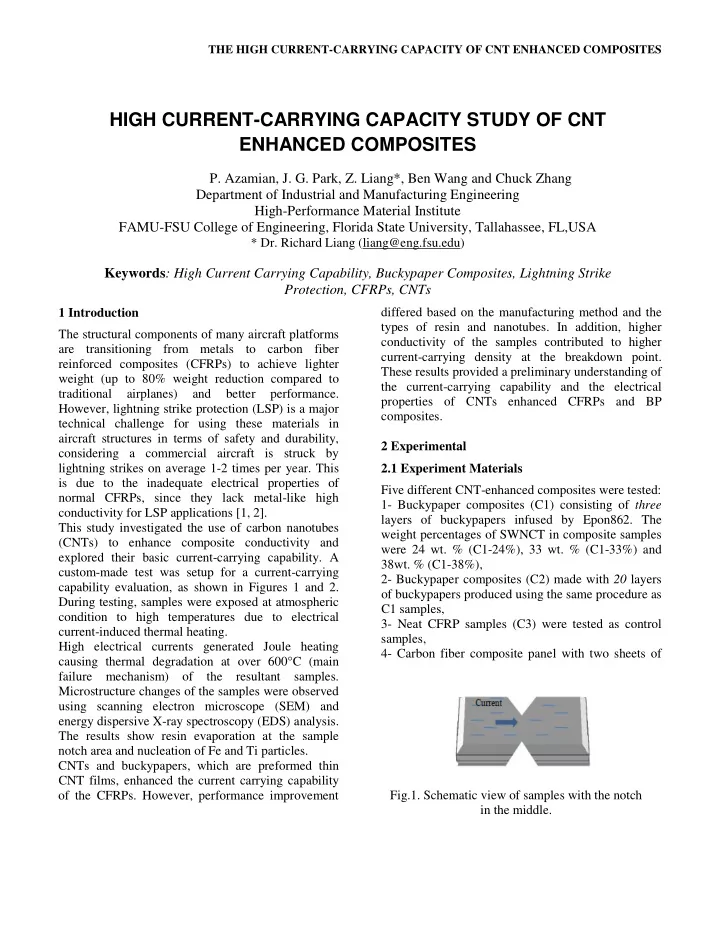
1 Introduction The structural components of many aircraft platforms are transitioning from metals to carbon fiber reinforced composites (CFRPs) to achieve lighter weight (up to 80% weight reduction compared to traditional airplanes) and better performance. However, lightning strike protection (LSP) is a major technical challenge for using these materials in aircraft structures in terms of safety and durability, considering a commercial aircraft is struck by lightning strikes on average 1-2 times per year. This is due to the inadequate electrical properties of normal CFRPs, since they lack metal-like high conductivity for LSP applications [1, 2]. This study investigated the use of carbon nanotubes (CNTs) to enhance composite conductivity and explored their basic current-carrying capability. A custom-made test was setup for a current-carrying capability evaluation, as shown in Figures 1 and 2. During testing, samples were exposed at atmospheric condition to high temperatures due to electrical current-induced thermal heating. High electrical currents generated Joule heating causing thermal degradation at over 600°C (main failure mechanism) of the resultant samples. Microstructure changes of the samples were observed using scanning electron microscope (SEM) and energy dispersive X-ray spectroscopy (EDS) analysis. The results show resin evaporation at the sample notch area and nucleation of Fe and Ti particles. CNTs and buckypapers, which are preformed thin CNT films, enhanced the current carrying capability

  • f the CFRPs. However, performance improvement

differed based on the manufacturing method and the types of resin and nanotubes. In addition, higher conductivity of the samples contributed to higher current-carrying density at the breakdown point. These results provided a preliminary understanding of the current-carrying capability and the electrical properties of CNTs enhanced CFRPs and BP composites. 2 Experimental 2.1 Experiment Materials Five different CNT-enhanced composites were tested: 1- Buckypaper composites (C1) consisting of three layers of buckypapers infused by Epon862. The weight percentages of SWNCT in composite samples were 24 wt. % (C1-24%), 33 wt. % (C1-33%) and

  • 38wt. % (C1-38%),

2- Buckypaper composites (C2) made with 20 layers

  • f buckypapers produced using the same procedure as

C1 samples, 3- Neat CFRP samples (C3) were tested as control samples, 4- Carbon fiber composite panel with two sheets of

HIGH CURRENT-CARRYING CAPACITY STUDY OF CNT ENHANCED COMPOSITES

  • P. Azamian, J. G. Park, Z. Liang*, Ben Wang and Chuck Zhang

Department of Industrial and Manufacturing Engineering High-Performance Material Institute FAMU-FSU College of Engineering, Florida State University, Tallahassee, FL,USA

* Dr. Richard Liang (liang@eng.fsu.edu)

Keywords: High Current Carrying Capability, Buckypaper Composites, Lightning Strike Protection, CFRPs, CNTs

Fig.1. Schematic view of samples with the notch in the middle.

slide-2
SLIDE 2

THE HIGH CURRENT-CARRYING CAPACITY OF CNT ENHANCED COMPOSITES

buckypaper (C4) on each side, and 5- MWCNT enhanced carbon fiber composites (C5) with different weight percentages of long MWCNTs that were mixed with the epoxy resin. 2.2 Test set up and procedure Prior to the high current-carrying capability (HCC) test, electrical conductivity values of the samples were tested by two-probe electrical conductivity. In addition, C-scan nondestructive examination (NDE) analysis was performed using a Sonix 1190 Ultrasonic Testing Machine before the samples were cut to identify the quality and defects. The C-scan test images indicate that the samples had even resin distribution and few defects. For the HCC tests, the samples were cut into 20 x 10 mm rectangular shapes with a notch cut in the middle to pass the maximum current, as shown in Figure 1. The notch width was between 0.5-2 mm. Samples were attached to thin copper plates by silver paste on a custom made sample holder (Figure 2) and connected to a direct current source. The IR camera (Ann Arbor Sensor System IR AXT 100) monitored the temperature and the two probe resistance of the sample was measured simultaneously (Figure 3). The current was applied to the sample and set to increase by 0.02 Amps every minute. For the CFRP samples, the initial current was set at 0.05 amps. 3 Results and Discussions After electrical current exposure, samples generated high temperatures due to the Joule heating. The main failure mechanism was thermal degradation of resin.

  • Fig. 4 shows the images during the process of the

HCC test. As the system temperature increased at higher currents, initially the resin was melting from the composite and began to smoke. When the temperature reached the ignition temperature, sparks and fire were observed. Figure 5 shows the comparison of the samples before and after the HCC

  • tests. Samples were damaged by abrupt burning at a

flash point of 600°C at atmospheric condition. The increase of electrical conductivity of the materials Fig.2. Customized sample holders that is attached to the D.C source with two wires. Fig.4. Optical images of CFRP during the HCC test. (a) The resin emerging out of the sides of the notch. (b) Sample at the notch starting to smoke. (c) The middle of the notch area is starting to get red, showing the increase of the temperature. (d) Sample

  • n fire at the notch area which leads the complete

breakdown. (a) (b) (c) (d) Fig.3. Schematic views of the test setup, the IR camera, the sample and the sample attached to the copper plates with a silver paste to ensure good contacts.

slide-3
SLIDE 3

THE HIGH CURRENT-CARRYING CAPACITY OF CNT ENHANCED COMPOSITES

contributed to the increase of current-carrying density at the breakdown point. In addition, thermogravimetric analysis (TGA), differential scanning calorimetry (DSC) and dynamic mechanical analyzer (DMA) tests were performed before the HCC tests to obtain the materials characteristics, and the results were used to explain the HCC tests results. Among the BP composites samples, the main factors for enhancing the high current density were CNT concentration, the quality

  • f the panels and the resin type. The number of layers
  • f the BP sheets used the composites appeared to

have no effect. Accordingly, the HCC results were consistent with the DMA results – the higher the storage modulus, the higher the achieved current carrying density at the break down point. The TGA and DSC results were consistent with the first breakdown point (point that the sample began to smoke) and the final breakdown point temperature (point of ignition). SEM images show that when the resin evaporated at the notch (Figure 6), the nanotubes bundled together, and some char was formed on the nanotubes (Figure 7). Figure 8 shows the SEM images of BP composite (C2) cross section after HCC test. Most of the SWNTs were burned at over 600°C and only MWNT and catalyst particles remained. The EDS analysis in Figure 8 (c) and (d) showed large Fe and Ti peaks, indicating nucleation of iron particles on the samples’ notch surfaces, which resulted from the catalyst in Fig.8. SEM image of cross-section of sample C2 a) the image a layer of the damaged buckypaper in the sample, b) image with a higher magnitude of the same section of the nanotubes, as it is shown the nanotubes are bundled together and there are some particles attached to the NTs, c), d) EDS spectrum

  • f sample C2 at the specified regions shown in the

SEM images. (a) (b) (c) (d) Fig.6. SEM image of the C3 sample at the notch showing no resin exist after the HCC test. Fig.7. SEM image of 38% BP sample (a) before, (b) after the HCC test. (a) (b) Fig.5. Sample images before and after HCC tests of CFRP/BP composite samples (C4): (a) and (b) before test; (c) after breakdown point, complete breakage, and d) incomplete breakage

slide-4
SLIDE 4

THE HIGH CURRENT-CARRYING CAPACITY OF CNT ENHANCED COMPOSITES

  • SWNTs. Ti particles were originated from the mild

abrasion of the sonicator tip during CNT dispersion process. The EDS results for all the samples showed specific substantial element or component changes in the samples and were consistent with the results from the buckypaper structural changes in Dr. Park et. al [3]. Figure 9 summarizes the current-carrying density

  • f different samples. As can be seen in the case of

sample C5, the higher MWNT loading leads higher electrical conductivity and higher breakdown current density. Fig.9. Comparison of the current density of different samples. References

[1] T. Gibson, S. Putthanarat, J. C. Fielding, A. Drain, K. Will, M. Stoffel. “Conductive nanocomposites: Focus on lightning strike protection”. 39th International SAMPE Technical Conference, October (2007). [2] J. G. Park, S. Li, R. Liang, X. Fan, C. Zhang, B. Wang, “The high current-carrying capacity of various carbon nanotube-based buckypapers”. Nanotechnology, 19(18), 185710 (2008). [3] J. G. Park, S. Li, R. Liang, C. Zhang and B. Wang, “Structural changes and Raman analysis of single-walled carbon nanotube buckypaper after high current-density induced burning”, Carbon 46 (9), 1175 (2008).