
SLIDE 1
STUDY ON THE TOURISM CARRYING CAPACITY FOR THE ISLAND OF MAHE
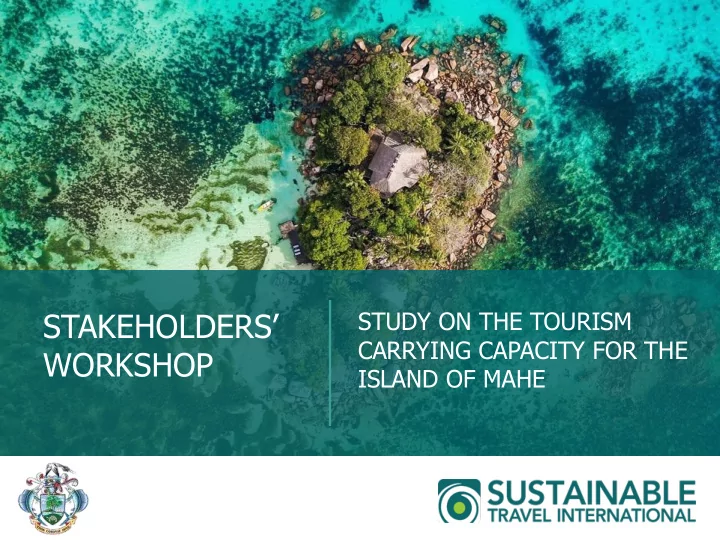
STAKEHOLDERS STUDY ON THE TOURISM CARRYING CAPACITY FOR THE - - PowerPoint PPT Presentation
STAKEHOLDERS STUDY ON THE TOURISM CARRYING CAPACITY FOR THE WORKSHOP ISLAND OF MAHE BONZOUR! WHAT WELL ACCOMPLISH Purpose of Snapshot of Carrying Current Capacity Study Conditions Understanding Defining a of Key Issues Path
STUDY ON THE TOURISM CARRYING CAPACITY FOR THE ISLAND OF MAHE
Understanding
and Impacts Snapshot of Current Conditions
Purpose of Carrying Capacity Study Defining a Path Forward
Welcome participants
9:00-9:15pm
Introduction and Visitor site exercise
9:15-9:30pm
Present snapshot of conditions
9:30-10:00pm
Coffee break
10:15- 10:30pm
Q&A and Individual Activity
10:00- 10:15pm 10:30- 11:30pm 11:30- 12:00pm
Group Activity Group Presentations and closing remarks
Paloma Zapata Project Lead
Robert Chappell Technical Advisor Daniella Larue
Project Manager
Diana Körner Consultant Ryan Sharp, PhD Social Scientist
Degradation of land and marine ecosystems Overconsumptio n of natural resources Excess waste and pollution Harm to wildlife and loss of biodiversity
Diminished quality of life for local people Displacement of local communities Loss of cultural traditions, values, and heritage Economic leakage
Supporting environmenta l conservation efforts and protection of sensitive ecosystems Providing more inclusive and greater income- generating
for underserved communities Driving economic growth and supporting sustainable development in developing destinations Fostering preservation and enhanced appreciation
culture and heritage
To establish the current tourism
development status with regards to a
number of key indicators To define the acceptable amount of
change of certain parameters in view of
achieving sustainable development on these small and vulnerable islands
Identification of tourism Carrying Capacity Priority Issues
Establish Desired Conditions and Thresholds Recommendations on the tourism development model
Quality of visitor experience Economic contribution
Residents quality of life Environmental protection and conservation
Define desired conditions and thresholds for tourism growth and associated impacts from tourism that balances:
Step 1. Research Priority Issues Step 2. Capture Visitor Inputs Step 3. Capture Resident, Industry and Expert Inputs Step 4. Validate Findings Step 5. Establish Conditions and Thresholds
Secondary Data
Desk Research
Tourist Input
Intercept survey at airport and GPS traker
Resident Input
Town hall meetings
Expert Input
Public, Private and NGO sector workshops
Tourism Master Plan, 2018 La Digue Vision 2032, Seychelles Strategic Land Use and Development Plan, 2015 Tourism Sector Strategy, 2019 Carrying Capacity Studies (2013, 2014, 2016) Value Chain Analysis, 2016
Visit each of the 3 Touristic site location
desired condition
threshold condition
Source: WTTC, 2019
2018 Rank (out of 185 countries) 2018 T&T GDP growth (%) 2018 Country GDP (US$ Bn) 2018 T&T contribution to GDP (US$ Bn) 2018 T&T % of country GDP 2018 Economy GDP growth (%) 2018 T&T contributio n to employme nt (000s) 2018 T&T % of country employme nt 2029 T&T contributio n to employme nt (000s) Jobs created by T&T 2018- 2029 (000s)
Ethiopia 1 48.6 78.3 7.4 9.4 7.8 2,186 8.3 2,587 401 Seychelles 20
8.5
1.6 1.1
67.1
4.6 31 66.7 33 2
Top 20 Countries – Fastest Growing in Terms of T&T GDP (WTTC)
2017 Tourism’s TOTAL Contribution to GDP %
3 Maldives
76.6%
4 Seychelles
65.3%
29 Mauritius
23.4%
48 Madagascar
16.6%
REGIONAL COUNTRY RANKINGS
Source: WTTC, 2018
Source: WTTC, 2018
2017 Amount % of total
Direct contribution to GDP
SCR 5,339.6mn 26.4%
Total contribution to GDP
SCR 13,192.0mn 65.3%
Direct employment
12,500 jobs 26.5%
Total employment
30,500 jobs 66.0%
Visitor exports
SCR 7,926.6mn 40.2%
T&T investment
SCR 2,022.7mn 29.3%
130,046 384,204
50,000 100,000 150,000 200,000 250,000 300,000 350,000 400,000 450,000
2000 2001 2002 2003 2004 2005 2006 2007 2008 2009 2010 2011 2012 2013 2014 2015 2016 2017 2018 2019
2000-2008 CAGR 3.1% 2009-2017 CAGR 10.4% 2017-2019 CAGR 4.8% 2009-2019 Increased by 2.4
Source: MOT Tourism Master Plan, Tourism Department
Visitor Arrivals By Air (2000-2019)
19,798 6131 43,978
5,000 10,000 15,000 20,000 25,000 30,000 35,000 40,000 45,000 50,000 2004 2005 2006 2007 2008 2009 2010 2011 2012 2013 2014 2015 2016 2017 2018 2019 Source: SPA 2019
2014-2019 CAGR 48.3% 2004-2019 CAGR 15.6% 2009-2019 Increased by 2.2
Cruise Passenger Arrivals (2010-2019)
1968 1366 1555
500 1000 1500 2000 2500 2010 2011 2012 2013 2014 2015 2016 2017 2018 Source: MOT Tourism Master Plan, 2018
2010-2016 CAGR -7% 2010-2018 CAGR -3% 2016-2018 CAGR 6.7%
Tourism Earnings Per Visitor USD$
Ratio of local residents to annual tourism arrivals Total population of Seychelles 97,625 Total Stay-over Arrivals 384,204 Tourists per resident 3.94
Source: NBS, 2019; TD, 2019; Telegraph.uk, 2017
6,704 8,042 10,168 15,900 22,262 27307 35816
77% 81% 0.1 0.2 0.3 0.4 0.5 0.6 0.7 0.8 0.9 1
5,000 10,000 15,000 20,000 25,000 30,000 35,000 40,000 2010 2011 2012 2013 2014 2015 2016 2017 2018
2010-2018 CAGR: 23,3%
Source: NBS
Crimes against visitors in 2019: 214 (Mahe, 153; Praslin 52; La Digue, 9) The Safety & Security Committee has been created to address crimes against visitors.
Recorded crime cases (including traffic offences) (2010 – 2019)
6490 14546 64… 58% 59% 60% 57% 63% 0% 10% 20% 30% 40% 50% 60% 70% 80% 90% 100% 2000 4000 6000 8000 10000 12000 14000 16000 2013 2014 2015 2016 2017 2018 2019 Average Number of Beds Available 2013 - 2018 Occupancy rate
2013-2019 CAGR: 13.4%
Source: NBS Migration, Tourism 2018 Report (table 20)
In 2015 the Government introduced a moratorium on the construction of hotels with more than 24 rooms, in order to curb new developments and reduce pressure
2013-2019 Increased by 2.2
Bed Supply Growth and Occupancy Rate (2013 – 2019)
Source: NBS, 2019
Hotel Bed Distribution, 2019
Mahe Praslin La Digue Inner Islands Outer Islands Total % Large Hotels
(24+ rooms)
3172 802 138 234 142 4488 31% Medium Hotels 318 598 176 60 50 1202 8% Small Hotels 458 302 186 252 32 1230 8% Guest Houses B&B 320 72 68 22 482 3% Guest Houses 214 136 160 58 568 4% Self-Catering 3220 1294 588 44 5146 35% Total Land Beds 7702 3204 1316 670 224 13116 90% Floating Beds 1084 290 34 22 1430 10% Grand total 8786 3494 1350 692 224 14546 % 60% 24% 9% 5% 2%
fast-track initiative.
Source: NBS, 2019
MAHE
Number of tourism beds in 2000 Number of tourism beds in 2016 Number of tourism beds in 2019 Increase between 2000 and 2019 [x times] Occupancy Rate 2018 Large + Medium Hotels 1,050 3,502 3630 3.5 77% Small Hotels 268 640 318 1.2 Guesthouses 136 514 534 4 49% Self-Catering 142 2,670 3220 23 52% Total 1,596 7,326 7702 4.8
Beau Vallon, Bel Ombre and Glacis: reserved for Seychellois only and shall be limited to 20 rooms per developer.
Source: NBS, 2019
PRASLIN
Number of tourism beds in 2000 Number of tourism beds in 2016 Number of tourism beds in 2019 Increase between 2000 and 2019 [x times Occupancy Rate 2018 Large + Medium Hotels 1,038 1,390 1400 1.4 69% Small Hotels 230 374 302 1.3 Guesthouses 68 170 208 3.1 63% Self-Catering 138 1,032 1294 9.4 62% Total 1,474 2,966 3204 2.2
Source: NBS, 2019
LA DIGUE
Number of tourism beds in 2000 Number of tourism beds in 2016 Number of tourism beds in 2019 Increase between 2000 and 2019 [x times] Occupancy Rate 2018 Large + Medium Hotels 198 304 314 1.6 65% Small Hotels 88 176 186 2.1 Guesthouses 68 204 228 3.4 47% Self-Catering 28 506 588 21 59% Total 382 1,190 1316 2.1
New accommodation establishments on La Digue was limited to 5 rooms per establishment
Hotel Bed Development Pipeline
Mahe Praslin La Digue Others Total Large 5272 1428 444 7644 Medium 182 48 230 Small 20 20 Guesthouses + B&B Self-catering 1316 333 155 12 1816 Total Pipeline 6790 1809 155 456 9710 Existing supply 8786 3494 1350 916 14546 % Increase 77% 52% 11% 50% 67% Despite the moratorium on large hotels, hotels that had obtained prior approval from GoS, a number of large hotels are either under construction or on various stages of planning. From the small facilities 161 of 346 are change of use (485 beds). Additionally there are 127 new project where the number of beds are not stated.
Land Use
world)
competition for suitable land
50M mark on Praslin and La Digue removed 3 years ago
tourism investment and operations
flooding, landslides, etc.
DMCS OFFER SIMILAR TOURS AND SITES, CONTRIBUTING TO CONGESTION IN ROADS AND SITES AND LOW DIVERSIFICATION
Market share estimate
DMCs: 50%
Main sites
Beaches, Mission Lodge, Tea Factory, Takamaka distillery
Restaurant Offer
Limited supply creole and specialty restaurants
Traffic congestion
Rental cars, private cars with guide, minibus
Cultural products
Low visitation to cultural sites and availability of local handicraft
Small ecotourism offer
Only small number of hiking trails in active use, limited specialized guides
Solid Waste Management
/ per visitor 1-2kg a day
landfills have reached or are about to reach saturation points.
equipped with a sanitary landfill.
Digue close to area of high touristic value / Praslin next to the airport
use plastic
Sewage Management
Digue; new sanitation facility started construction in La Digue (2020)
infiltration is due to pipe damage; plans for rehabilitation of existing sewage system in Greater Victoria
to the PUC sewage system
treatment plants; bacterial tests every 2 years for license renewal
Water Management
104 (Mahe- 102.2; Praslin - 111.6; La Digue -123.5) / Tourism consumption: 70l – 600l per room night
increasing by 4-5% per year
harvesting and storage is limited. Desalinated introduced = 16% of water supply
limited; desalination is the only viable
Energy Management
consumption per capita;
– 26.42 (kWh) Energy consumption per guest night
fossil fuels;
– plans to increase renewable energy sources by 5% in 2020 and 15% by 2030
represented 34% of energy consumed (Energy Study, 2016);
– 13.06 MT Co2 per guest night
Airport Capacity
departures per 100 resident
airline seats to 2,260 per day.
to 2018, the load factors have increase by 3% from 2018-2019.
support the construction of the second runway/taxiway.
2050 doubles current capacity
Port/Jetty Capacity
yet ready to accept 100k visitors
compared to the other regional islands
108% berth occupancy
sized vessels, IPHS (Ile du Port) can accommodate 1 vessel
– Extension plan 40m outward and 320m length (2021).
expanded facilities.
present jetty
Economic contribution of tourism Safety and security Hotel Development
SOCIO-ECONOMIC ISSUES
Product Offering Tourism dependent economy Congestion
Water consumption Energy consumption Sewage treatment
PHYSICAL-ENVIRONMENTAL
Sustainable tourism practices Waste management Conservation of ecosystems and biodiversity
AS INDIVIDUALS RANK PRIORITY ISSUES Each participant will receive a printed piece of paper to prioritize issues
ACTIVITY 1
AS GROUPS DEFINE IDEAL TOURISM MODEL Participants will be asked to come to a consensus in evaluating tourism arrivals and bed supply ideal condition and thresholds as well as evaluating the tourism experience factors that will allow the destination to increase visitor spend.
ACTIVITY 2
in Seychelles, either by government entities, other national institutions or external international sources.
Seychelles, and whose achievement is desired, as it would imply a significant improvement of current conditions (baseline data). Desired conditions should not be seen as static figures and they should be regularly reviewed and updated, and they should seek continuous improvement of conditions, once targets have been met.
cannot (or should not) be exceeded, as this would mean a significant deterioration of the current conditions to which immediate actions should be taken. Just as desired conditions, thresholds should also be regularly reviewed and updated to reflect on limits
Red
Current condition has already exceeded the threshold
Yellow
Current condition has exceeded the ideal condition but not the threshold
Green
Current condition is already at the ideal condition, however, monitoring is important
1 2 3
Paloma Zapata palomaz@sustainabletravel.org