
SLIDE 1
Carrying Capacity
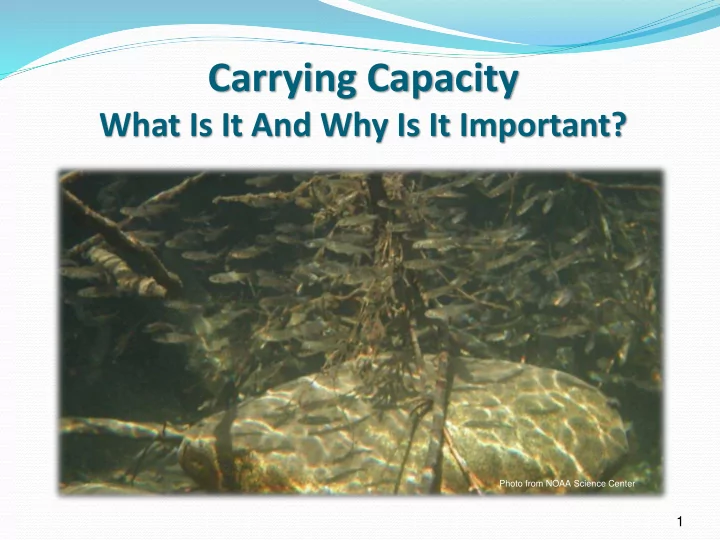
What Is It And Why Is It Important?
1
Photo from NOAA Science Center
Carrying Capacity What Is It And Why Is It Important? Photo from - - PowerPoint PPT Presentation
Carrying Capacity What Is It And Why Is It Important? Photo from NOAA Science Center 1 Definition Carrying Capacity = Number of individuals or biomass the resources of a given area can support usually through the most unfavorable period of the
1
Photo from NOAA Science Center
Maximum Environmental Load
Linked to Tolerance Limits and Limiting Factors (aka ecological concerns)
Habitat Capacity (C)
2
Defines an upper limit to population growth as density
increases.
3
Density Independent Factors = Population
Density Dependent Regulation = Population
4
Plot of population size
and population growth rate (or surrogates such as survival rates, natality, productivity, recruits, individual growth rates, movement).
There is a negative
relationship between population size and growth rate.
5
200 400 600 800 1,000 1,200 500 1,000 1,500 2,000 2,500
Parr/Spawner
Chiwawa Spring Chinook
100 200 300 400 500 600 700 800 500 1,000 1,500 2,000 2,500
Smolts/Spawner Number of Spawners
6
Plot population size over
Logistic function
𝑂𝑢 = 𝐿 1 + 𝐿 − 𝑂0 /𝑂0 𝑓−𝑠𝑢 𝑒𝑂 𝑒𝑢 = 𝑠𝑂 1 − 𝑂 𝐿
7
Number Time
Logistic Growth
Carrying Capacity
K
Fit Ricker, Beverton-Holt, and
Smooth Hockey Stick models to stock (spawners) and recruitment (fry, parr, smolts) data.
Ricker:
𝑭(𝑺) = 𝜷𝑻𝒇−𝜸𝑻 𝑳 = 𝜷 𝜸 𝒇−𝟐
Beverton-Holt:
𝑭 𝑺 = 𝜷𝑻 𝜸 + 𝑻 𝜷 = 𝑳
Smooth Hockey Stick:
𝑭(𝑺) = 𝑺∞ 𝟐 − 𝒇
−
𝜷 𝑺∞ 𝑻
𝑺∞ = 𝑳 8
100 200 300 400 500 600 200 400 600 800 1000
Recruits Parents
Smooth Hockey Stick Model
Pop 1 Pop 2 Pop 3 Pop 4 50 100 150 200 250 300 200 400 600 800 1000
Recruits Parents
Ricker Model
Pop 1 Pop 2 Pop 3 Pop 4
Habitat capacity can be
estimated as the product of habitat area and fish/habitat relationships.
Percent Habitat Saturation
Model (PHS) 𝑄𝐼𝑇 = 100 𝑦 𝐸𝑗 𝑦 𝑈
𝑗
Others include Net Rate of
Energy Intake (NREI) models, Habitat Suitability (HSI) models, and Quantile Regression Forest (QRF) models.
9
ISEMP/CHaMP (2015)
Assume we can define a population unambiguously. Assume that we can measure population size
Assume that we have a biologically relevant time-step
Assume a uniformity of nature.
10
Stock-recruitment
functions were fit successfully to parr and yearling smolt data.
11
20,000 40,000 60,000 80,000 100,000 120,000 500 1,000 1,500 2,000
Number of Smolts Number of Spawners
B-H Model Ricker Model Hockey Stick
40,000 80,000 120,000 160,000 200,000 500 1,000 1,500 2,000
Number of Parr Number of Spawners
Chiwawa Spring Chinook
B-H Model Ricker Model Hockey Stick
12
Model Parameter Population capacity (K) Productivity Stock size A B Ricker 271.37 0.0009 114,749 271 1,149 Hockey Stick 11.61 314.44 110,747 314 1,055 Beverton-Holt 144,927.36 416.36 144,927 348 ∞ Model Parameter Population capacity (K) Productivity Stock size A B Ricker 149.84 0.0011 50,572 150 917 Hockey Stick 10.75 172.33 46,494 172 809 Beverton-Holt 57,854.21 289.50 57,854 200 ∞
Selecting 90% Reference
Carrying Capacity (K) 90,557 vs 50,572 Stock Size 833 vs 917
13
20,000 40,000 60,000 80,000 100,000 120,000 140,000 160,000 500 1,000 1,500 2,000
Number of Smolts Number of Spawners
Chiwawa Spring Chinook
Ricker Model
Mean 90% RI
14
Used in life-cycle models to
predict effects of different recovery scenarios.
Used by hatchery managers
to inform supplementation programs.
Used by harvest managers to
set appropriate escapement and harvest levels.
Used by restoration
practitioners to guide restoration actions.
15
Managers (Mars) Researchers (Venus)
16