
SLIDE 1
IEEE AgRA Webinar 6/9/2016 | 1
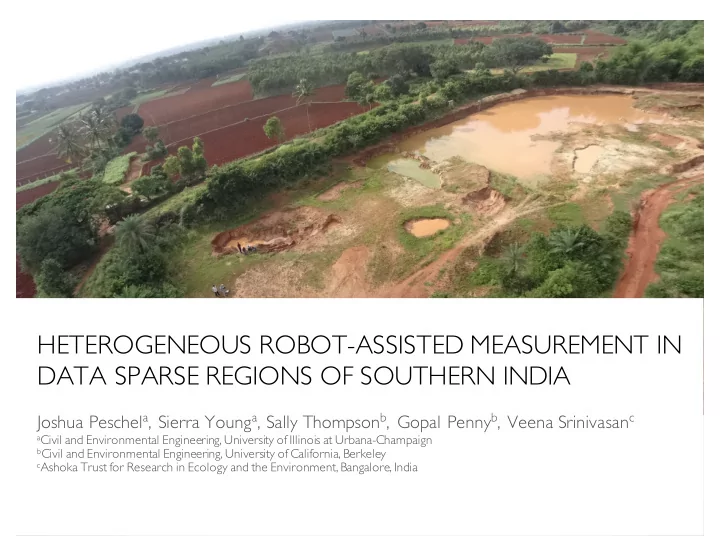
HETEROGENEOUS ROBOT-ASSISTED MEASUREMENT IN DATA SPARSE REGIONS OF SOUTHERN INDIA
Joshua Peschela, Sierra Younga, Sally Thompsonb, Gopal Pennyb, Veena Srinivasanc
aCivil and Environmental Engineering, University of Illinois at Urbana-Champaign bCivil and Environmental Engineering, University of California, Berkeley cAshoka Trust for Research in Ecology and the Environment, Bangalore, India