
SLIDE 1
RCEP, DPRI, KYOTO UNIV.
Heat Signature on the Chelungpu Fault Associated with the 1999 - - PowerPoint PPT Presentation
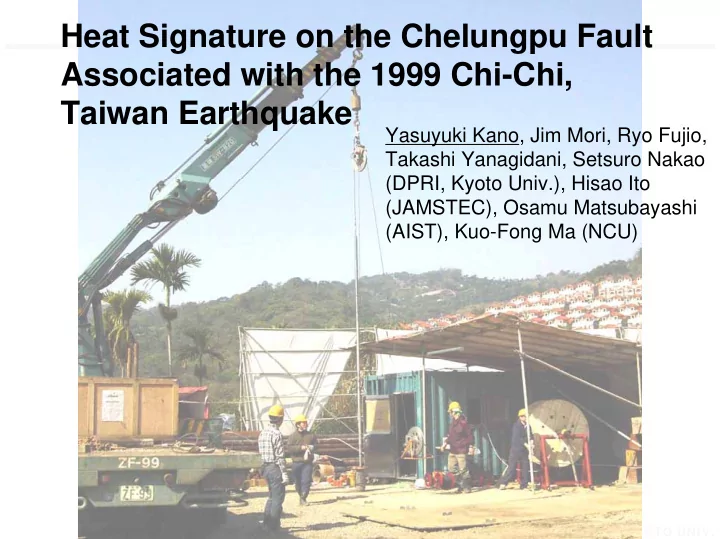
Heat Signature on the Chelungpu Fault Associated with the 1999 Chi-Chi, Taiwan Earthquake Yasuyuki Kano, Jim Mori, Ryo Fujio, Takashi Yanagidani, Setsuro Nakao (DPRI, Kyoto Univ.), Hisao Ito (JAMSTEC), Osamu Matsubayashi (AIST), Kuo-Fong Ma
RCEP, DPRI, KYOTO UNIV.
RCEP, DPRI, KYOTO UNIV.
1
1
1
RCEP, DPRI, KYOTO UNIV.
RCEP, DPRI, KYOTO UNIV.
RCEP, DPRI, KYOTO UNIV.
RCEP, DPRI, KYOTO UNIV.
1.0 m/min 0.4 m/min
RCEP, DPRI, KYOTO UNIV.
RCEP, DPRI, KYOTO UNIV.
RCEP, DPRI, KYOTO UNIV.
2
RCEP, DPRI, KYOTO UNIV.
RCEP, DPRI, KYOTO UNIV.
RCEP, DPRI, KYOTO UNIV.
RCEP, DPRI, KYOTO UNIV.
RCEP, DPRI, KYOTO UNIV.
RCEP, DPRI, KYOTO UNIV.
RCEP, DPRI, KYOTO UNIV.
RCEP, DPRI, KYOTO UNIV.
RCEP, DPRI, KYOTO UNIV.
w w
2 2
RCEP, DPRI, KYOTO UNIV.
RCEP, DPRI, KYOTO UNIV.
RCEP, DPRI, KYOTO UNIV.
RCEP, DPRI, KYOTO UNIV.
RCEP, DPRI, KYOTO UNIV.
RCEP, DPRI, KYOTO UNIV.
RCEP, DPRI, KYOTO UNIV.
RCEP, DPRI, KYOTO UNIV.
RCEP, DPRI, KYOTO UNIV.
RCEP, DPRI, KYOTO UNIV.
RCEP, DPRI, KYOTO UNIV.
RCEP, DPRI, KYOTO UNIV.
1
RCEP, DPRI, KYOTO UNIV.
RCEP, DPRI, KYOTO UNIV.