
SLIDE 1
John D. Corrigan, PhD Ohio State University 1
Health and Disability Risks with Lifetime History of TBI
John D. Corrigan, PhD
Professor Department of Physical Medicine and Rehabilitation Director Ohio Brain Injury Program
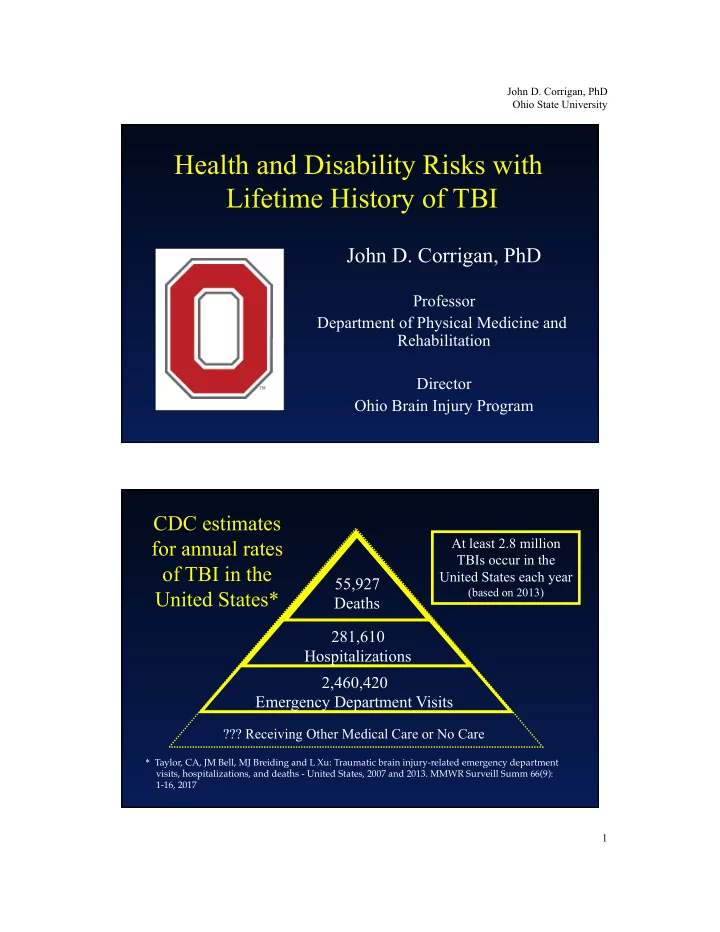
CDC estimates for annual rates
- f TBI in the
United States*
55,927 Deaths 281,610 Hospitalizations 2,460,420 Emergency Department Visits
??? Receiving Other Medical Care or No Care At least 2.8 million TBIs occur in the United States each year
(based on 2013)
* Taylor, CA, JM Bell, MJ Breiding and L Xu: Traumatic brain injury-related emergency department visits, hospitalizations, and deaths - United States, 2007 and 2013. MMWR Surveill Summ 66(9): 1-16, 2017