
SLIDE 1
HDFC Top 100 Fund
(An open ended equity scheme predominantly investing in large cap stocks)
Performance & experience on your side
November 2018
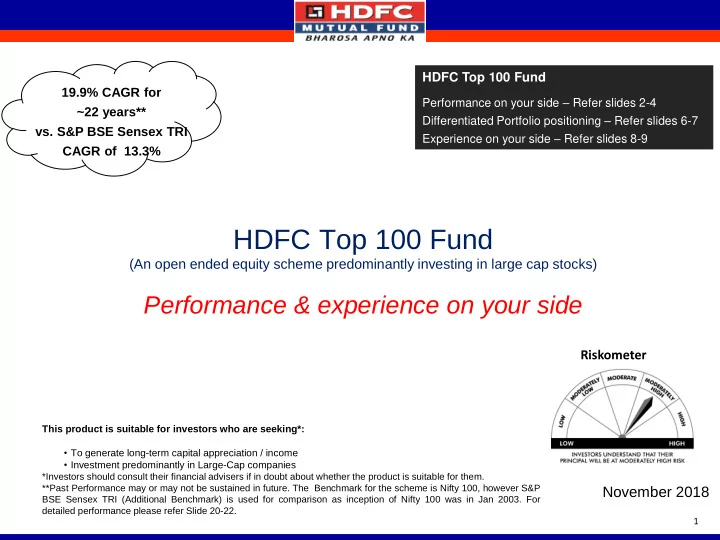
Riskometer
This product is suitable for investors who are seeking*:
- To generate long-term capital appreciation / income
- Investment predominantly in Large-Cap companies
*Investors should consult their financial advisers if in doubt about whether the product is suitable for them. **Past Performance may or may not be sustained in future. The Benchmark for the scheme is Nifty 100, however S&P BSE Sensex TRI (Additional Benchmark) is used for comparison as inception of Nifty 100 was in Jan 2003. For detailed performance please refer Slide 20-22.
19.9% CAGR for ~22 years**
- vs. S&P BSE Sensex TRI
CAGR of 13.3%
1
HDFC Top 100 Fund
Performance on your side – Refer slides 2-4 Differentiated Portfolio positioning – Refer slides 6-7 Experience on your side – Refer slides 8-9