
SLIDE 1
Top 100
The European Employee Ownership Top 100
Sixth European Meeting of Employee Ownership Brussels, 14-15 December 2006
TOP10 CAP en images 2
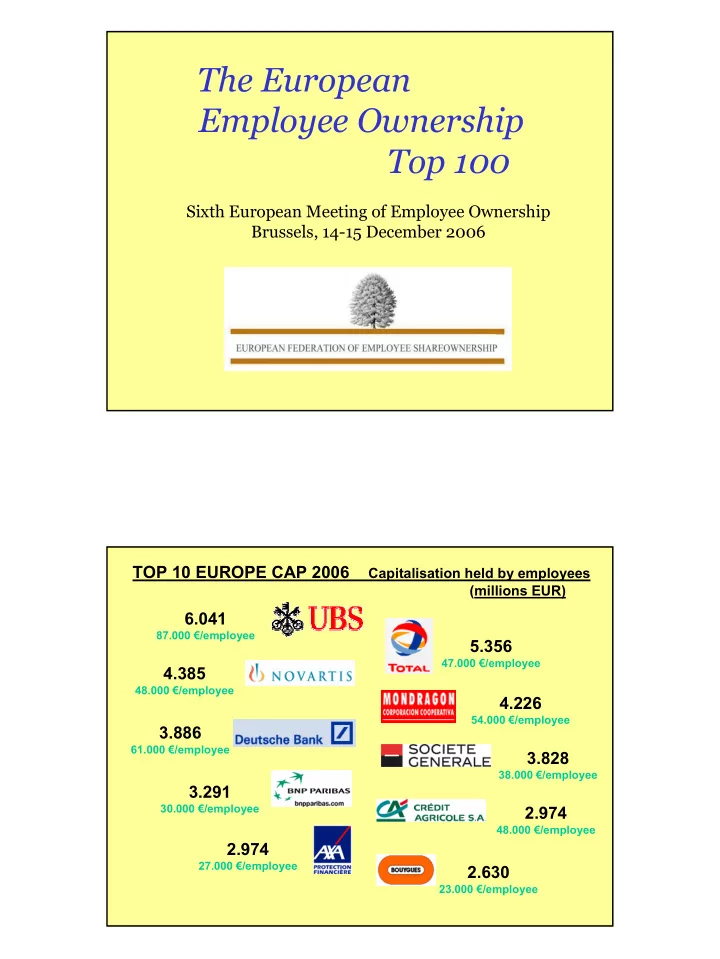
TOP 10 EUROPE CAP 2006 Capitalisation held by employees
(millions EUR)
6.041
87.000 €/employee
4.385
48.000 €/employee
3.886
61.000 €/employee
3.291
30.000 €/employee
2.974
27.000 €/employee
5.356
47.000 €/employee
4.226
54.000 €/employee
3.828
38.000 €/employee
2.974
48.000 €/employee
2.630
23.000 €/employee