gwd gau branch
play

(GWD GAU Branch) = Friday 14 August 2020, 14:30-15:30 via 150 - PowerPoint PPT Presentation

Presentation Tales Carvalho-Resende 17/08/2020 GWD GAU e-Talk - 14 August 2020 The importance of groundwater Case Study-Assessment of the impacts of climate THE WORLDS WATER RESOURCES variability on total water Imagine: storage All the


  1. Presentation Tales Carvalho-Resende 17/08/2020 GWD GAU e-Talk - 14 August 2020 The importance of groundwater Case Study-Assessment of the impacts of climate THE WORLD’S WATER RESOURCES variability on total water Imagine: storage All the water on the planet (GWD GAU Branch) = Friday 14 August 2020, 14:30-15:30 via 150 litre container Zoom Talk by Tales Carvalho Resende BUT JUST 4 LITRES 150 LITRES ARE FRESH !! Attendance: type name and affiliation in the chat Questions: type questions in the chat Courtesy: switch off / mute your microphone and camera
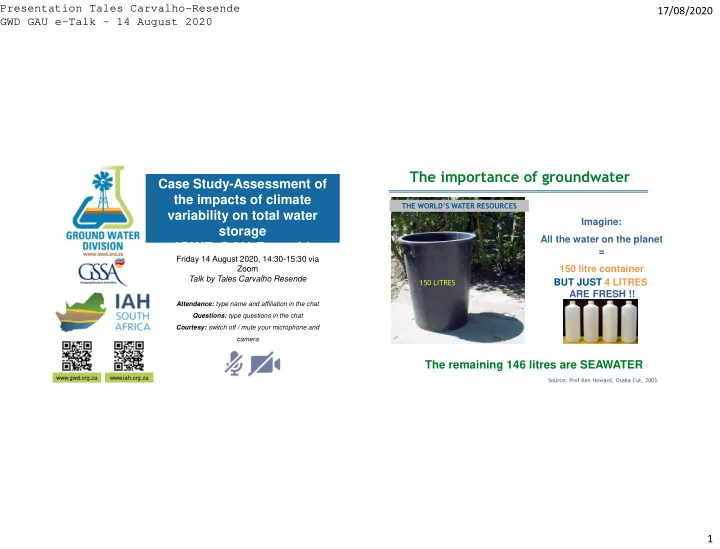
 The remaining 146 litres are SEAWATER www.gwd.org.za www.iah.org.za Source: Prof Ken Howard, Osaka Cut, 2003 1

  2. Presentation Tales Carvalho-Resende 17/08/2020 GWD GAU e-Talk - 14 August 2020 The importance of groundwater Global context Out of these 4 litres: 3 litres are frozen (earth’s ice caps, X X X permafrost regions) … leaving one lonely litre of freshwater … and 99% the lonely litre of GROUNDWATER freshwater is GROUNDWATER !! 99% It is essential that we protect and manage groundwater resources effectively! 4 Source: Prof Ken Howard, Osaka Cut, 2003 2

  3. Presentation Tales Carvalho-Resende 17/08/2020 GWD GAU e-Talk - 14 August 2020 Global context Climate indices  Climate indices have cycles (a couple of years, decadal, multi-  Earth’s climate has exhibited marked "natural" changes decadal….) and have what we call positive and negative phases  Factors influencing natural climate variability are changes in  El Niño Southern Oscillation (ENSO) → cycles of a couple of circulation and overturning in the oceans years  Over periods of a few years, fluctuations in global surface temperatures of a few tenths of a degree are common The changes are “measured” through climate indices   Among the known climate indices:  El Niño Southern Oscillation (ENSO),  Indian Ocean Dipole (IOD),  Pacific Decadal Oscillation (PDO),  Atlantic Multidecal Oscillation (AMO)  These climate indices are often correlated but it is still very difficult to assess to what extent 5 6 3

  4. Presentation Tales Carvalho-Resende 17/08/2020 GWD GAU e-Talk - 14 August 2020 Climate indices Main objective of the study  Atlantic Multidecal Oscillation (AMO) → cycles of several  decades Assess the impact of climate variability on recharge of two large aquifers (Stampriet and Karoo Sedimentary) in the Orange-Senqu River Basin despite the lack of continuous data as a means to support sound management strategies  Focus on two climate indices:  El Niño Southern Oscillation (ENSO)  Atlantic Multidecal Oscillation (AMO) 7 8 4

  5. Presentation Tales Carvalho-Resende 17/08/2020 GWD GAU e-Talk - 14 August 2020 Groundwater in the Orange-Senqu River Basin Groundwater in the Orange-Senqu River Basin  Potential impacts of climatic oscillations on groundwater dynamics in the Orange-Senqu River Basin have still not been largely addressed  Two large transboundary aquifers in the Orange- Senqu River Basin: Stampriet and Karoo Sedimentary  Lack of long-term groundwater level data to assess the dynamics of these large aquifers on the ground 10 5

  6. Presentation Tales Carvalho-Resende 17/08/2020 GWD GAU e-Talk - 14 August 2020 Methodology Challenges in a data-scarce setting  Use of gravity data supplied by satellites can provide Step 1: Run a simplified water balance model that a means to monitoring large scales changes in “reconstructs” past total water storage changes in the groundwater storage Stampriet and Karoo Sedimentary Aquifers from 1980 to 2016  However, satellite time observations are limited in time (e.g. GRACE data is available only since 2002) Step 2: Validation of the simplified water balance model and therefore may not capture full climate cycles (e.g. with GRACE and groundwater level data AMO) Step 3: Assessment of correlations between total water Hence, there is a need to “extend” GRACE time frame  storage changes and climatic indices, e.g. El Nino/La Nina to the past with adequate models to “reconstruct” (ENSO) and the Atlantic Multidecadal Oscillation (AMO) (ground)water storage fluctuations 11 12 6

  7. Presentation Tales Carvalho-Resende 17/08/2020 GWD GAU e-Talk - 14 August 2020 Step 1: Simplified water balance model Step 1: Simplified water balance model  From Carvalho Resende et al., 2018 (Hydrogeology Journal)  Model allows extending evaluation time-frame to the last 30-more years and therefore covers climatic oscillations cycles  Independent from GRACE data  Two variables only: Precipitation and Actual Evapotranspiration  Uses only global datasets for precipitation (GPCC) and evapotranspiration (GLEAM)  Data available in a monthly basis from 1980 to 2016 dS    P E R dt Total water storage variations S Precipitation P Actual ET E R Surface runoff  Total water storage changes in the Stampriet and the Karoo Sedimentary aquifers follow the same multi-decadal trend, i.e. increase from 1980 to Assumption: R = constant because at long term, total water storage variations are driven by groundwater storage variations   late 1990s and decrease from late 1990s to current days             Inter-annual trend is however different GWS S P dt Rdt E dt detrend P dt E dt mod el mod el 13 14 7

  8. Presentation Tales Carvalho-Resende 17/08/2020 GWD GAU e-Talk - 14 August 2020 Step 2: Validation of the model with GRACE data Step 2: Validation of the model with GRACE data Gravity Recovery and Climate Experiment (GRACE)  First satellite mission able to monitor total water-storage changes (including groundwater) remotely  Data available in a monthly basis since 2002  Data obtained from http://www.thegraceplotter.com  Total water storage changes in the Stampriet and the Karoo Sedimentary have a decreasing trend since 2002 15 16 8

  9. Presentation Tales Carvalho-Resende 17/08/2020 GWD GAU e-Talk - 14 August 2020 Step 2: Validation of the model with GRACE data Step 2: Validation of the model with groundwater level data  Validation: GRACE and Model total water storage changes in the  Validation: Groudwater level and Model total water storage changes in the Stampriet and the Karoo Sedimentary follow the same decreasing trend Stampriet and the Karoo Sedimentary follow the same trend 17 18 9

  10. Presentation Tales Carvalho-Resende 17/08/2020 GWD GAU e-Talk - 14 August 2020 Step 3: Correlations between total water storage changes Step 3: Correlations between total water storage changes and climatic indices and climatic indices  Atlantic Multi-decadal Oscillation (AMO) Positive AMO phase Negative AMO phase Change from negative to positive phase in late 1990s 19 20 10

  11. Presentation Tales Carvalho-Resende 17/08/2020 GWD GAU e-Talk - 14 August 2020 Step 3: Correlations between total water storage changes Step 3: Correlations between total water storage changes and climatic indices and climatic indices  El Niño/La Niña (ENSO) 2 3 4 1 2 1 3 4 Most significant total water storage changes usually occur when there is a El Niño/La Niña shift 21 22 11

  12. Presentation Tales Carvalho-Resende 17/08/2020 GWD GAU e-Talk - 14 August 2020 Conclusions and recommendations A big thanks to… • UNESCO Intergovernmental Hydrological Programme • The shallow aquifers of the Stampriet and Karoo • Piet Kenabatho Sedimentary aquifer systems aquifers are highly responsive to rainfall • Thato Setloboko • Bertram Swartz • Total water storage changes in the Stampriet and Karoo • Maria Amakali Sedimentary aquifers are correlated to changes of phases • Kwazi Majola of climatic indices: • Ramogale Sekwele • Multi-decadal scale: from the Atlantic Multi-decadal • Rapule Pule Oscillation (AMO) • Inter-annual scale: El Niño/La Niña (ENSO) • Need to strengthen links with metereological agencies in order to better understand rainfall patterns • Further work can provide insights for agriculture and livestock planning (especially during drought periods) and 23 24 Managed Aquifer Recharge schemes 12

Download Presentation
Download Policy: The content available on the website is offered to you 'AS IS' for your personal information and use only. It cannot be commercialized, licensed, or distributed on other websites without prior consent from the author. To download a presentation, simply click this link. If you encounter any difficulties during the download process, it's possible that the publisher has removed the file from their server.

Recommend


More recommend