SLIDE 1
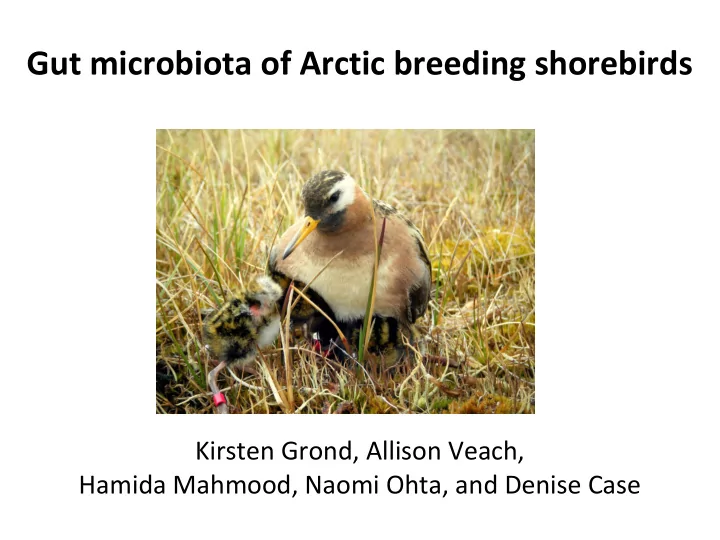
Gut microbiota of Arctic breeding shorebirds
Kirsten Grond, Allison Veach, Hamida Mahmood, Naomi Ohta, and Denise Case
SLIDE 2 Outline
- Background
- Research Question
- Experimental Design
- Methods & Analyses pipeline
- Local Alignment
- Multiple Sequence Alignment
- Classification & OTU Clustering
- OTU Classify
- Data visualization & Results
- Future Work
SLIDE 3
Background
SLIDE 4 Gut microbiota important in health (Kohl 2012)
- Nutritional uptake
- Detoxification
- Interactions with immune system
Humans: Unbalanced gut microbiota → Obesity, Diabetes, Gut inflammation (IBS), Depression
- (Bonfrate et al. 2013; Dinan & Cryan 2013; Fang & Evans 2013;
Le Chatelier et al. 2013)
Why gut microbiota?
SLIDE 5 Why shorebirds?
- Sensitive to change
- “Living on the edge”
- Many Arctic breeding species
declining fast
Dunlin Calidris alpina
SLIDE 6
Research Question
Intrinsic → Host species phylogeny Extrinsic → Environment
(breeding site, migration route, interaction with conspecifics etc.)
Do intrinsic or extrinsic factors determine gut microbiome composition in shorebirds?
SLIDE 7
Research Questions
Intrinsic → Host species phylogeny Extrinsic → Environment
(breeding site, migration route, interaction with conspecifics etc.)
Do intrinsic or extrinsic factors determine gut microbiome composition in shorebirds?
SLIDE 8
Experimental Design & Software
SLIDE 9 Sample collection 538 fecal samples of 10 shorebird species from 9 Arctic breeding sites Selected a subset of 138 samples, all from Dunlin to speed up analysis
- Making contigs for 538 samples took >200 hrs
Used the Illumina MiSeq platform to sequence the V4 region of the 16S ribosomal RNA
SLIDE 10 16S rDNA (double lines indicate variable or hypervariable; gray lines indicate highly conserved; V1 to V9 indicate major variable regions).
Tortoli E Clin. Microbiol. Rev. 2003;16:319-354
V4
SLIDE 11
Illumina MiSeq
SLIDE 12
Illumina MiSeq
Short fragments (V4) 291 bp
SLIDE 13
Illumina MiSeq
Short fragments (V4) ~250 bp Attach adapters for sequencing
SLIDE 14
Illumina MiSeq
Short fragments (V4) ~250 bp Attach adapters for sequencing Apply to flow cell with attached primer
SLIDE 15
Illumina MiSeq
Short fragments (V4) ~250 bp Attach adapters for sequencing Apply to flow cell with primers Amplify and create clusters
SLIDE 16
Illumina MiSeq
Short fragments (V4) ~250 bp Attach adapters for sequencing Apply to flow cell with primers Amplify and create clusters
SLIDE 17
www.mothur.org
SLIDE 18
Mothur in Beocat
Created shell files with Mothur commands in batch
SLIDE 19
SLIDE 20
Pipeline
make.contigs, summary.seqs, screen.seqs, trim.seqs
Local alignment
unique.seqs, summary.seqs, align.seqs
Multiple alignment
pre.cluster, chimera.uchime, classify.seqs, remove.lineage, cluster
Classification & OTU clustering
remove.rare, classify.otus, remove.lineage
OTU Classify
SLIDE 21
Methods: Local Alignment & Cleanup
SLIDE 22 Local Alignment
make.contigs(file=/homes/kgrond/Shorebird_seqs/mothur/allfecal)
- Combine forward and reverse fastq files and make contigs to
reduce PCR errors.
Sample ID Forward fastq Reverse fastq
SLIDE 23 Local Alignment
- Make contigs. algorithm -
make.contigs(file=/homes/kgrond/Shorebird_seqs/mothur/allfecal)
- Uses the Needleman algorithm for local alignment of paired end
sequences In case of… Gap: the quality score of the base must be over 25 to be considered real. Mismatch: require one of the bases to have a quality score 6 or more points better than the other, otherwise sequence will shown as “N”.
SLIDE 24 Local Alignment
Summary.seqs(fasta=/homes/kgrond/Shorebird_seqs/mothur/allfecal)
Most reads vary between 228 and 373 bases.
SLIDE 25 Cleanup the sequences
Screen.seqs(fasta=/homes/kgrond/Shorebird_seqs/mothur/allfecal.trim.contigs. fasta,group=/homes/kgrond/Shorebird_seqs/mothur/allfecal.contigs.groups, minlength=250, maxlength=350, maxambig=0)
- Length range between 250 – 350
- Sequences with ambiguous based are not retained
Summary.seqs
After each step, we run “Summary.seqs” to check if the previous command has worked.
SLIDE 26 Trim.seqs(fasta=/homes/kgrond/Shorebird_seqs/mothur/allfecal, maxhomop=8, flip=T)
- Any sequences with homopolymers (-ATCCCCCCCCC) are removed.
- Take the reverse complement of PCR primer.
“flip=T(rue)
Cleanup the sequences
SLIDE 27
Multiple Alignment, Clean up, Sequence Classification
SLIDE 28 Multiple Alignment, Sequence Cleanup and Classification
Unique.seqs(fasta=/homes/kgrond/Shorebird_seqs/mothur/allfecal. trim.contigs.good.fasta)
- Analysis uses only representative sequences to reduce computing time
Summary.seqs (fasta=/homes/kgrond/Shorebird_seqs/mothur/allfecal.trim.contigs. good.trim.unique.fasta, name=homes/kgrond/Shorebird_seqs/mothur/allfecal.trim.contigs. good.trim.names)
SLIDE 29 Multiple Alignment, Sequence Cleanup and Classification
Align.seqs(fasta=homes/kgrond/Shorebird_seqs/mothur/allfecal. trim.contigs.good.trim.unique.fasta , reference=/homes/kgrond/Shorebird_seqs/mothur/ silva.bacteria. fasta)
- Template DB is SILVA containing aligned 16S rRNA sequences
SLIDE 30 Multiple Alignment, Sequence Cleanup and Classification
Pre.cluster(fasta=/homes/kgrond/Shorebird_seqs/mothur/allfecal. trim.contigs.good.trim.unique.good.align, name=/homes/kgrond/Shorebird_seqs/mothur/allfecal.trim.contigs. good.trim.good.names, group=/homes/kgrond/Shorebird_seqs/mothur/allfecal.contigs.good. good.groups, diffs=2)
- Sequences abund ranked then sequences within ≤ 2 mismatches are merged
- Reduces computing time and accounts for sequenced generated artifacts
SLIDE 31 Multiple Alignment, Sequence Cleanup and Classification
chimera.uchime (fasta=/homes/kgrond/Shorebird_seqs/mothur/allfecal.trim.contigs. good.trim.unique.good.precluster.align, name=/homes/kgrond/Shorebird_seqs/mothur/allfecal.trim.contigs. good.trim.unique.good.precluster.names)
- Remove chimeric sequences
Picture credit: http://drive5. com/usearch/manual/chimera_formation.html
SLIDE 32 Multiple Alignment, Sequence Cleanup and Classification
remove.seqs (accnos=/homes/kgrond/Shorebird_seqs/mothur/allfecal.trim. contigs.good.trim.unique.good.precluster.uchime.accnos, fasta=/homes/kgrond/Shorebird_seqs/mothur/allfecal.trim.contigs. good.trim.unique.good.precluster.align, name=/homes/kgrond/Shorebird_seqs/mothur/allfecal.trim.contigs. good.trim.unique.good.precluster.names, dups=T)
Picture credit: http://drive5. com/usearch/manual/chimera_formation.html
SLIDE 33 Multiple Alignment, Sequence Cleanup and Classification
classify.seqs(fasta=/homes/kgrond/Shorebird_seqs/mothur/allfecal. trim.contigs.good.trim.unique.good.precluster.pick.align, name=/homes/kgrond/Shorebird_seqs/mothur/allfecal.trim.contigs. good.trim.unique.good.precluster.pick.names, template=/homes/kgrond/Shorebird_seqs/mothur/trainset9_032012 .rdp.fasta, taxonomy=/homes/kgrond/Shorebird_seqs/mothur/trainset9_03201 2.rdp.tax, cutoff=80)
- Template database used is the RDP training set 9
- Taxonomy is also derived from RDP DB
- Cutoff retains only taxonomic affiliations with bootstrap support at 80%
SLIDE 34 Multiple Alignment, Sequence Cleanup and Classification
remove.lineage(fasta=/homes/kgrond/Shorebird_seqs/mothur/allfecal.trim. contigs.good.trim.unique.good.precluster.pick.align, name=/homes/kgrond/Shorebird_seqs/mothur/allfecal.trim.contigs.good.trim. unique.good.precluster.pick.names, taxonomy=/homes/kgrond/Shorebird_seqs/mothur/allfecal.trim.contigs.good.trim. unique.good.precluster.pick.rdp.wang.taxonomy, taxon=unknown-Bacteria; unclassified-Bacteria;Cyanobacteria_Chloroplast;unclassified-Bacteria; Cyanobacteria_Chloroplast;Chloroplast-Archaea-Mitochondria-Eukaryota)
- Template database used is the RDP training set 9
- Taxonomy is also derived from RDP DB
- Cutoff retains only taxonomic affiliations with bootstrap support at 80%
SLIDE 35 Multiple Alignment, Sequence Cleanup and Classification
AY457915 Bacteria(100);Firmicutes(100);Clostridiales(100);Johnsonella_et_rel. (100);Johnsonella_et_rel.(100);Johnsonella_et_rel.(100); Eubacterium_eligens_et_rel.(100);Lachnospira_pectinoschiza(100);unclassified; unclassified;unclassified;unclassified;unclassified;
Sequence name 100% bootstrap support for Domain Bacteria, Phylum Firmicutes, Order Clostridiales… Genus
SLIDE 36
OTU Classification
SLIDE 37 OTU Clustering and Classification
Dist.seqs(fasta=final.fasta, cutoff=0.10) Cluster (column=/homes/kgrond/Shorebird_seqs/mothur/name=final.dist, name= /homes/kgrond/Shorebird_seqs/mothur/)
- Dist.seqs calculated uncorrected pairwise distances between aligned and classified
sequences
- Using a nearest neighbor clustering method, distances are used to create OTU’s at
97% similarity threshold
SLIDE 38 OTU Clustering and Classification
Classify.otu(list= /homes/kgrond/Shorebird_seqs/mothur/ final.an. list, name /homes/kgrond/Shorebird_seqs/mothur/ final.names, taxonomy /homes/kgrond/Shorebird_seqs/mothur/ final. taxonomy, label=0.03)
- Using taxonomy after removing unwanted sequences and rare OTU’s, the
updated RDP reference is used to classify each OTU to lowest taxonomic affiliation with acceptable bootstrap support
SLIDE 39
Data Visualization
SLIDE 40 Data Visualization
Ecological studies involve hundreds of samples and large result sets. The ability to visualize large quantities of information helps scientists evaluate and understand results. Tools for working with large data sets included:
- Excel for the generation of pivot tables and charts
that automatically group data into sets for display. (Sample data only as we hit the limit at 1 million rows x 16k columns - not enough for our results.)
- D3 for creating dynamic displays in the browser
using only data and text files. (Powerful SVG graphics in the new HTML5 canvas. No development environment required.)
SLIDE 41 Click here to go to site: http://people.cis.ksu. edu/~dmcase/bird_microbiota/sites.html#
Content displayed with various GIS options. Interactive charts.
SLIDE 42 Side bars with site data
http://people.cis.ksu.edu/~dmcase/bird_microbiota/sites.html https://github.com/ksucase/bird_microbiota l
SLIDE 43
Results
SLIDE 44 Phylogenetic analysis
Ryu et al. 2014. Journal of Applied and Environmental Microbiology
SLIDE 45 Venn diagram
Grond et al. Western Hemisphere Shorebird Group, Santa Marta, Colombia. 2013
SLIDE 46 Future work
1) Finish analysis of all fecal samples in Mothur/Beocat 2) Analyze results to reflect:
- inter and intraspecific differences in gut microbiota
- Site and migration route related differences in gut
microbiota
- Life-time change in gut microbiota → Embryo, chick,
adult
- Inter-annual variation in gut microbiota
SLIDE 47
Questions?