
SLIDE 1
ASX:PAN www.panoramicresources.com
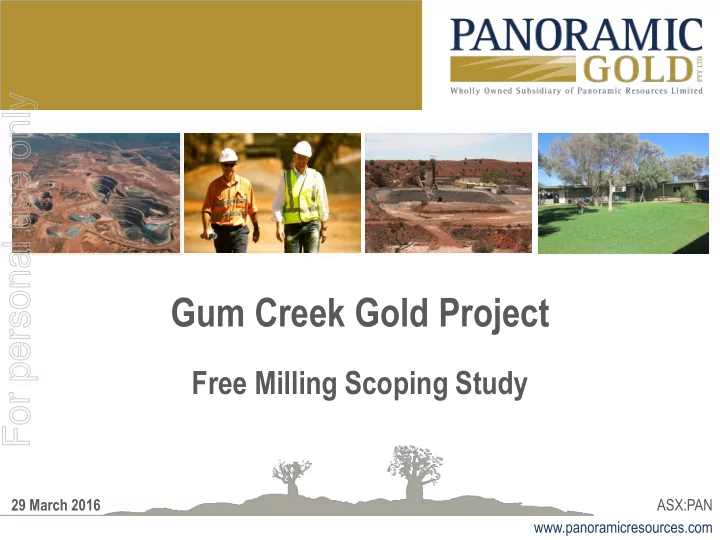
Gum Creek Gold Project
Free Milling Scoping Study
29 March 2016
Gum Creek Gold Project Free Milling Scoping Study 29 March 2016 - - PowerPoint PPT Presentation
For personal use only Gum Creek Gold Project Free Milling Scoping Study 29 March 2016 ASX:PAN www.panoramicresources.com Disclaimer Cautionary Statements This presentation includes information extracted from Panoramic Resources Limited ASX
ASX:PAN www.panoramicresources.com
29 March 2016
Cautionary Statements This presentation includes information extracted from Panoramic Resources Limited ASX announcement dated 18 March 2016 entitled “Gum Creek Gold Project – Free Milling Scoping Study”. The Scoping Study is based on low-level technical and economic assessments, and is insufficient to support the estimation of Ore Reserves or to provide assurance of an economic development case at this stage, or to provide certainty that the conclusions of the Scoping Study will be realised. There is a low level of geological confidence associated with Inferred Mineral Resources and there is no certainty that further exploration work will result in the determination of Indicated Mineral Resources or that the production target itself will be realised. No New Information or Data This presentation contains references to exploration results and Resource estimates, all of which have been cross referenced to previous market announcements made by the Company. The Company confirms that it is not aware of any new information or data that materially affects the information included in the relevant market announcements and, in the case of estimates of Mineral Resources, that all material assumptions and technical parameters underpinning the estimates in the relevant market announcement continue to apply and have not materially changed. Forward Looking Statements This presentation may contain certain “forward-looking statements” which may not have been based solely on historical facts, but rather may be based on the Company’s current expectations about future events and results. Where the Company expresses or implies an expectation or belief as to future events or results, such expectation or belief is expressed in good faith and believed to have a reasonable basis. However, forward looking statements are subject to risks, uncertainties, assumptions and other factors, which could cause actual results to differ materially from future results expressed, projected or implied by such forward-looking statements. Such risks include, but are not limited to metals price volatility, currency fluctuations, increased production costs and variances in ore grade or recovery rates from those assumed in mining plans, as well as political and operational risks in the Countries and States in which we operate or sell product to, and governmental regulation and judicial
circumstances after the date of this announcement, or to reflect the occurrence of unanticipated events, except as may be required under applicable securities laws.
2
3
Aerial view of Gum Creek Gold open pits and tailings dam
1Refer to page 27 Appendix 2 - Resources as at 30 June 2015 2Refer to page 2 Disclaimer - Cautionary Statements
4
Located 120km west of Wiluna, Western Australia
Large tenement package ~800km2
Significant Resource 17.4Mt for 1.3Moz with an average grade of 2.3g/t Au1
Total production 290,000oz2
Annual production 60,000oz pa2 (years 1-4)
Initial project life of 6 years
AISC A$1,209/oz
Pre-production capital of only A$62M
Gum Creek Gold Project location and regional gold production
5
Short lead time to cashflow ~12 months
Modest pre-production capital ~A$62M
Low metallurgical risk due to previous production history
Quick ramp up to 60,000ozpa production
Attractive NPV and IRR
6
Operating Metric Assumption/Result
Gold Price and Exchange Rate A$1,700/oz (US$1,275/oz and A$1:US$0.75) Mining Inventory 4.9Mt @ 1.94g/t Au for 309,000oz contained gold Mining Method Open Pit Project life (processing) 5.8 years Life of Mine (“LOM”) production 290,000oz Au (average ~60,000oz for years 1-4) Pre-production capital cost A$62M Average LOM All-in sustaining costs (“AISC”) A$1,209/oz Au LOM processing recovery 95% LOM strip ratio 9.4:1 Pre-tax IRR 30% LOM Revenue A$496M LOM EBITDA A$149M LOM Pre-tax cash flow A$82M LOM Pre-tax NPV A$37M (11% real), A$58M (5% real) Construction period ~12 months
Cautionary Statements This presentation includes information extracted from Panoramic Resources Limited ASX announcement dated 18 March 2016 entitled “Gum Creek Gold Project – Free Milling Scoping Study”. The Scoping Study is based on low-level technical and economic assessments, and is insufficient to support the estimation of Ore Reserves or to provide assurance of an economic development case at this stage, or to provide certainty that the conclusions of the Scoping Study will be realised. There is a low level of geological confidence associated with Inferred Mineral Resources and there is no certainty that further exploration work will result in the determination of Indicated Mineral Resources or that the production target itself will be realised.
7
Situated within the East Murchison Province of the Western Australian Archaean Yilgarn Craton which has a history of significant gold production
The Project area covers ~800km2 of the Gum Creek Greenstone Belt (GCGB), an Archean sequence dominated by volcanic and sedimentary rocks
The GCGB is 110kms long and up to 24kms wide
Surrounded by intrusive granitoids
Margins of the belt are typically dominated by contact-metamorphosed basalts and banded iron formations
8
Gum Creek Gold Project
Quartz-Carbonate (± pyrite, arsenopyrite, galena & sphalerite) veins
Developed in brittle dilational openings about major N-S shears within competent mafic host
Locally very high grade > 20g/t Au
Often overlain by extensive supergene enriched zones
Type examples - Swan, Swift & Kingfisher Refractory – ductile shear hosted mineralisation
Very fine grained gold associated with sulphide poor, intense biotite- sericite altered shear zones
Grade typically 5 – 10g/t Au
Sulphides dominated by arsenopyrite, pyrrhotite
Type example - Wilsons Non refractory – ductile shear hosted mineralisation
Very fine grained gold associated with sulphide poor, weak biotite altered shear zones
Grade typically 1 – 2g/t Au
Sulphides dominated by pyrite
Type example – Howards BIF hosted mineralisation
Quartz- pyrrhotite-gold replacement of magnetite layers
Grade 1 – 10g/t Au
Preferentially developed about fractures and fold hinges
Type examples – Omega, Psi Quartz Veins
Sheeted to anastomosing quartz veins and lenses developed in shears straddling granodiorite contact
Generally sulphide poor with grade 1 – 5g/t Au
Type examples – Montague deposits
9 Gum Creek Gold tenements and main Resources*
*Refer to page 27 Appendix 2 - Resources as at 30 June 2015
10
11
Resource Indicated Inferred Total % Inferred (by Tonnes) Mined Tonnes (t) Grade (g/t Au) Contained Metal (Oz Au) Mined Tonnes (t) Grade (g/t Au) Contained Metal (Oz Au) Mined Tonnes (t) Grade (g/t Au) Contained Metal (Oz Au) Swan 1,252,153 2.41 97,127 622,589 2.04 40,908 1,874,742 2.29 138,035 33% Swift 877,384 2.40 67,825 290,498 2.54 23,757 1,167,882 2.44 91,582 25% Howards 1,809,920 1.30 75,818 83,730 1.20 3,220 1,893,650 1.30 79,038 4% Total 3,939,457 1.90 240,770 996,817 2.12 67,885 4,936,274 1.94 308,655 20%
*In relation to the use of the term “Mining Inventory”, the Company advises:
the Mining Inventory includes Inferred Resources and is not an Ore Reserve and will not be classified as such until such time as a pre-feasibility study has been undertaken; and
the term has been used in the ASX Announcement dated 18 March 2016 and this presentation to refer to Mineral Resources to which reasonable assumptions relating to Modifying Factors in mining of the Swan, Swift and Howards open pit Resources, (as detailed in Appendix 1) have been applied.
12
Existing Infrastructure Airstrip Tailings dam Accommodation village* Waste dump Water Roads New Infrastructure Process plant Expanded camp BOOT power station
*Relocation of some accommodation and facilities from other Panoramic sites Gum Creek Gold central infrastructure area
Processing Plant
Three stage crushing, single ball mill,
gravity circuit, cyanide leach, elution circuit and gold room
Throughput rates fresh material - 800ktpa oxide/transitional material - 1Mtpa
Metallurgy
Historic metallurgical recoveries on Swan
and Swift ore range between 97-99%
Testwork on Swan and Swift Resources
confirmed these recoveries
Testwork on Howards mineralisation
returned average recoveries of 91%
Recoveries used in study - average of
95% over LOM
LOM Production - 290,000oz Au
Annual Production - 60,000oz pa (years 1-4)
13 The chart above shows the proportion and relative sequencing of the combined Swan, Swift and Howards Indicated and Inferred Resources over the initial Project life of approximately six years
14
Modest pre-production capital of $62M
Based on all new processing plant
Utilises some existing capital items from
Competitive cash costs due to a combination of:
Free milling feed High metallurgical recoveries
Opportunities to save on capital and
Competitive bid for construction of
plant and associated infrastructure
Utilise second hand equipment in
the processing plant
Optimise the process flowsheet Competitive bid for open pit mining
contract
Higher metallurgical recoveries
15
Item A$/t Milled A$/oz Au Total Mining (after waste and cutbacks) 35 598 Processing* 28 471 General and Administration 4 72 Sustaining Capital 1 17 Royalties 3 45 Refining 5 All in sustaining cost (AISC) 72 1,209
Operating Costs Summary
*Processing cost includes road train haulage of Howards Item Initial Capital (A$M) Sustaining (A$M) Total over Project Life (A$M)
Capitalised Mining 13
Processing Facilities 36
Processing Infrastructure 5
Tailings Dam 1 3 4 Other 7
Sustaining
2 Total 62 5 67
Capital Cost Summary
Revenue - $496M
EBITDA - $A149M
Pre-tax cashflow - $72M
Pre-tax NPV (11%) - $37M
IRR - 30%
Average all-in sustaining cost A$1,209/oz
16
Pre-tax cashflows and NPVs at various gold prices A$/oz Gold Price 1,600 1,700 1,800 1,900 2,000 Cashflow after royalties (A$M) 53 82 110 139 168 NPV 11% after royalties (A$M) 17 37 57 77 97
17
Highly leveraged to A$/oz gold price
A$100/oz increase in Au price adds ~A$30M to pre-tax cashflow Opportunities
Exploration success
Incorporation of additional Resources (free milling or refractory)
Optimisation of mining schedules and production rates
Optimisation of process flow sheet
Operating and capital cost reductions Risks
A$ gold price
Operating costs eg. diesel price
Metallurgical recoveries
Project financing
Regulatory approvals
Project NPVs at various discount rates
5% 6% 7% 8% 9% 10% 11% Pre Tax NPV (A$M) at A$1,700/oz 58 54 51 47 43 40 37
18
Commence detailed design and optimisation for delivery of a Feasibility Study
Seek indicative funding terms for the Project
Enhance shareholder value through:
sale of the project; or hold and develop
19 Swan Swift Aerial view of the Swan and Swift open pits
20
Gum Creek hosts a significant gold Resource of 1.3Moz
The Free Milling Scoping Study demonstrates a pathway to 60,000oz annual production for a modest capital cost
The Project has a relatively short lead time to production of 12 months and significant leverage to A$ gold price
The Study significantly enhances the value of the asset for sale and/or to hold and develop
Potential for further exploration success and option to mine and treat the significant Wilsons refractory Resource
Potential to re-rate Panoramic as an Australian gold development stock, noting that Australian gold equities have
21
22
23
1930 - Gold first discovered at Gidgee
1931-1954 - small scale mining
1950’s-1980’s - exploration by a number of international companies including INCO, WMC, AMAX and AMOCO for nickel and copper-zinc massive sulphides
1983 - AMOCO (later Cyprus) commenced gold exploration
1988 - Australian Resources Ltd commenced mining
2005 - operations placed onto care and maintenance (gold price <US$500/oz)
Total historic production in excess of 1Moz gold
Panoramic:
24 Since closure in 2005 the gold price in A$ has risen approximately 2.5 times
1988 -October 1999 - Australian Resources Limited mined Gidgee
October 1999 - Abelle Limited took over Gidgee and resumed mining in February 2000
End 2002 - Open pit mining ceased and milling was reduced to two weeks on, one week off to treat underground ore from Swan Bitter
2003 - Abelle was taken over by Harmony Gold
November 2003 - Harmony sold Gidgee to Legend Mining
March 2005 - Legend ceased mining at Gidgee and placed the operation onto care and maintenance
Ore produced from 20
underground mines
25
The Mining Inventory is based on existing Resources (refer to Appendix 2), and there has been no conversion of the Mineral Resource to Ore Reserve as a result of this Study. Key mining parameters used in the Study are as follows:
26
Swan
The open pit Resource model includes modifying factors
Cut off grade – 0.7g/t Au
Minimum Mining Width – 4m downhole
Internal Dilution – 2m downhole
Edge Dilution – 1m either side downhole
High Grade Cuts – Oxide – 10g/t, Transitional – 20g/t, Fresh – 200g/t
Pit Slope angles range from 35-45 degrees
Ramp widths range from 12-18m wide with a gradient of 1 in 9
Batter angles range from 55 degrees near the surface to 70 degrees at the base, berm heights of 20m and minimum berm widths of 7m
Swift
The open pit Resource model includes modifying factors
Cut off grade – 0.7g/t Au
Minimum Mining Width – 4m downhole
Internal Dilution – 2m downhole
Edge Dilution – 1m either side downhole
High Grade Cuts – Oxide – 20g/t, Transitional – 30g/t, Fresh – 30g/t
Pit Slope angles range from 40-44 degrees
Ramp widths range from 12-18m wide with a gradient of 1 in 9
Batter angles range from 55 degrees near the surface to 70 degrees near the base, berm heights of 20m and minimum berm widths of 5m
Howards
The following mining factors were applied to the Howards Resource
Cut off grade – 0.88g/t Au
Mining dilution – 5%
Mining loss – 5%
Pit Slope angles were 45 degrees
Ramp widths range from 12-18m wide with a gradient of 1 in 9
Batter angles of 70 degrees, berm heights of 20m and berm widths of 5m
27 27
Note: further 2012 Edition JORC compliance tables are referenced in the Company’s ASX announcement dated 30 September 2015
Swan OC resource cutoff grade is 0.7 g/t. The resources (both Ind & Inf categories) have been partially diluted over a minimum mining width of 2.5m and confined to a Aus $2,000 Whittle pit shell Eagles Peak resource cutoff grade is 1.2 g/t Orion resource cutoff grade is 1.3 g/t Deep South resource cutoff grade is 1.2 g/t Swan UG resource cutoff grade is 4.0 g/t for Indicated resource wireframes near historic workings and 6.0 g/t for Inferred resource wireframes away from historic workings. In transitioning the Swan UG resource from JORC2004 to 2012 in 2015 the Inferred resource cut-off grade has gone from 5.0 to 6.0 g/t
Swift UG resource cutoff grade is 6.0 g/t. In transitioning the Swift UG resource from JORC2004 to 2012 in 2015 the Inferred resource cut-off grade has gone from 5.0 to 6.0g/t Au Omega UG resource cutoff grade is 3.0 g/t Kingfisher UG resource cutoff grade is 3.0 g/t Individual Project Resources and Reserves are stated on an equity basis The information in this report that relates to the Swan OC, Eagles Peak, Orion, Deep South, Swan UG, Swift UG, Omega, and Kingfisher Mineral Resources is based on information compiled by or reviewed by Dr Spero Carras (FAusIMM). Dr Carras is the Executive Director of Carras Mining Pty Ltd and was acting as a consultant to Legend Mining Ltd in 2006 and Panoramic Resources Ltd in 2012. Dr Carras has sufficient experience that is relevant to the style of mineralisation and type of deposit under consideration and to the activity which they are undertaking to qualify as a Competent Person as defined in the 2004 Edition of the Australian Code for Reporting of Exploration Results, Mineral Resources and Ore Reserves. Dr Carras consents to the inclusion in the report of the matters based on their information in the form and context in which it appears. Heron South resource cutoff grade is 0.5 g/t Howards resource cutoff grade is 0.5 g/t Specimen Well resource cutoff grade is 0.5 g/t Toedter resource cutoff grade is 0.5 g/t Wilsons resource cutoff grade is 2.0 g/t Individual Project Resources and Reserves are stated on an equity basis Competent Persons Statement - The information in this report that relates to the Heron South, Howards, Specimen Well, Toedter and Wilsons Mineral Resources is based on information compiled by or reviewed by Andrew Bewsher (AIG) and Ben Pollard (AIG & MAusIMM). Andrew Bewsher and Ben Pollard are full time employees of BM Geological Services and have sufficient experience that is relevant to the style of mineralisation and type of deposit under consideration and to the activity which they are undertaking to qualify as a Competent Person as defined in the 2012 Edition of the Australian Code for Reporting of Exploration Results, Mineral Resources and Ore Reserves. Andrew Bewsher and Ben Pollard consent to the inclusion in the report of the matters based on their information in the form and context in which it appears.
28