Groundwater Flow Model of the Surficial and Intermediate Aquifers in - - PDF document

groundwater flow model of the surficial and intermediate
SMART_READER_LITE
LIVE PREVIEW

Groundwater Flow Model of the Surficial and Intermediate Aquifers in - - PDF document

Groundwater Flow Model of the Surficial and Intermediate Aquifers in the Vicinity of the Collier Hogan Oil Well Prepared for: Collier Resources Company 2600 Golden Gate Pkwy, Suite 112 Naples, FL 34105 Prepared by: Conestoga-Rovers &


slide-1
SLIDE 1

W o r l d w i d e E n g i n e e r i n g , E n v i r o n m e n t a l , C o n s t r u c t i o n , a n d I T S e r v i c e s

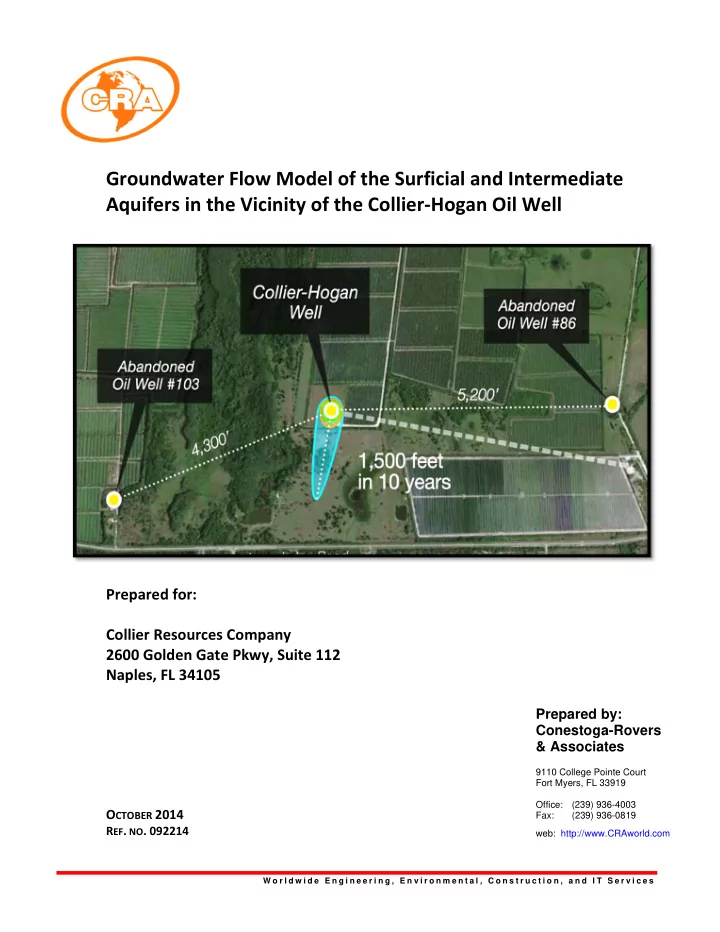
Groundwater Flow Model of the Surficial and Intermediate Aquifers in the Vicinity of the Collier‐Hogan Oil Well

Prepared for: Collier Resources Company 2600 Golden Gate Pkwy, Suite 112 Naples, FL 34105

OCTOBER 2014

  • REF. NO. 092214

Prepared by: Conestoga-Rovers & Associates

9110 College Pointe Court Fort Myers, FL 33919 Office: (239) 936-4003 Fax: (239) 936-0819 web: http://www.CRAworld.com

slide-2
SLIDE 2

Collier Resources Company Groundwater Flow Model

092214 October 2014

Table of Contents Page

Section 1.0 Introduction ................................................................................................. 1 Section 2.0 Conceptual Model ........................................................................................ 1 Section 3.0 Groundwater Flow Model Design ................................................................ 3 Section 4.0 Groundwater Flow Model Construction ....................................................... 3 Section 6.0 Solute Transport Model Design .................................................................... 5 Section 7.0 Solute Transport Model Construction .......................................................... 6 Section 8.0 Solute Transport Model Simulation ............................................................. 6 Section 9.0 Discussion and Conclusions .......................................................................... 6

List of Figures Figure 1 Site Location Map Figure 2 General hydrogeologic cross‐section of Collier County Figure 3 Hydrogeologic units and model layers Figure 4 Model domain, grid, and boundaries Figure 5 Expanded grid in vicinity of site Figure 6 Simulated groundwater flow system and particle tracking paths in surficial aquifer Figure 7 TMR model showing groundwater flow system and particle paths Figure 8 Hypothetical Surface Spill Plume Map* Appendix Appendix A Model input and output files

slide-3
SLIDE 3

Collier Resources Company Groundwater Flow Model

092214 October 2014

1

Section 1.0 Introduction

A quasi three‐dimensional groundwater flow and solute transport model was constructed by Conestoga‐ Rovers & Associates (CRA) to represent the Surficial Aquifer and Intermediate Aquifer Systems in the vicinity of the Collier‐Hogan oil well (Figure 1) and the path that a potential impact to the water table aquifer would follow. The site of the Collier‐Hogan well is located at 21985 Immokalee Road, Naples, Collier County, Florida. The model was constructed using the South Florida Water Management District’s Lower West Coast Surficial Aquifer System (LWCSAS) model developed by Marco Water Engineering, Inc. (2006) and the ground water flow model of western Collier County, Florida (Bennett, 1992). The purpose

  • f this effort was to develop a groundwater model flow to represent the combined aquifer systems

represented by the two models described above. The LWCSAS includes the water table aquifer, Lower Tamiami aquifer, and the Sandstone aquifer, and the Western Collier County model includes the above, in addition to the Mid‐Hawthorn and Lower Hawthorn aquifers. The model was developed using the U.S. Geological Survey (USGS) modular, three‐dimensional, finite difference, groundwater flow model MODFLOW in the graphical user interface Groundwater Vistas, Version 6.0 (Environmental Simulations, Inc.).

Section 2.0 Conceptual Model

Southwest Florida is underlain by three aquifer systems: the Surficial Aquifer System, the Intermediate Aquifer System, and the Floridan Aquifer System. A general geologic cross‐section of the Surficial and Intermediate Aquifer systems is provided as Figure 2. The Surficial Aquifer System consists of the Surficial and the Lower Tamiami Aquifers which are the predominant sources of water for both urban and agricultural demands. The thickness of the Surficial Aquifer System ranges from about 4 feet southwest of LaBelle in Hendry County to more than 200 feet in central and southern Collier County (SFWMD 2000). The productivity of the Surficial Aquifer System is variable. The Surficial aquifer is primarily composed of fine to medium grained quartz sands, with minor amounts

  • f clay and shell material from terrace deposits of Pleistocene and Holocene age and sandy biogenic

limestones of the Tamiami Formation Bennett 1992). Hydraulic conductivities range from 100 ft/day to greater than 3,500 ft/day, with the higher hydraulic conductivities occurring in the vicinity of the Cocohatchee watershed. The Surficial aquifer is separated from the Lower Tamiami aquifer by the lower Tamiami confining unit

  • ver all of Collier County. The Lower Tamiami aquifer is unconfined over most of Lee County. The lower

Tamiami confining unit is composed of low permeability, calcareous, sandy clays and poorly indurated limestones and dolostones that retard the vertical flow of water between the Surficial and Lower Tamiami aquifers (Bennett 1992). The leaky confining unit exhibits leakance values ranging from 10‐1 to 10‐5 per day. The semi‐confined Lower Tamiami Aquifer is composed primarily of gray limestone. It consists of sandy, shelly limestone and calcareous sandstone and generally occurs in the lower part of the Tamiami Formation (Reese 2000). In northern Lee County where the Tamiami confining unit is

slide-4
SLIDE 4

Collier Resources Company Groundwater Flow Model

092214 October 2014

2

absent or insignificant, the Lower Tamiami Aquifer is part of the unconfined water table aquifer. The majority of recharge to this aquifer is attributed to vertical flow through the surficial aquifer and the leaky lower Tamiami confining unit. Transmissivities in the Lower Tamiami aquifer range from approximately 10,000 ft2/day to 320,000 ft2/day. Transmissivities generally decrease eastward due to the thinning carbonate facies and increasing clastic composition of the aquifer (Knapp et al., 1986). This aquifer is the most predominant in Collier County due to its high productivity and quality, and shallow

  • depth. It is used for public water supply, residential self‐supply, and irrigation purposes. In general, the

wells in the Surficial Aquifer System yield high quality water. The Intermediate Aquifer System separates the Surficial Aquifer System from the Floridan Aquifer Systems and consists of the Sandstone aquifer, Mid‐Hawthorn aquifer, and the Lower Hawthorn aquifer, in addition to associated confining units. The upper Hawthorn confining unit separates the Lower Tamiami aquifer from the underlying Sandstone aquifer. In southern Collier County, the Sandstone aquifer pinches out, in which case, the upper Hawthorn confining unit lies on the mid‐Hawthorn confining unit. The upper Hawthorn confining unit consists of low permeability clays, dolosilts, and limestones with vertical leakance ranging from 10‐3 to 10‐5 day‐1. The semi‐confined Sandstone aquifer underlies the upper Hawthorn confining unit and is generally continuous across the model domain. The aquifer consists of sandy limestones, sandstone, sandy dolomites, and calcareous sands. The Sandstone aquifer is predominantly used for agricultural irrigation in Collier and Hendry counties; however, in Lee County the aquifer is utilized for both agricultural and urban withdrawals (Bennett, 1992). Transmissivity of the Sandstone aquifer ranges from approximately 160 ft2/day to 25,000 ft2/day. The mid‐Hawthorn confining unit underlies the Sandstone aquifer and consists of a thick sequence of clayey dolosilt that effectively restricts vertical flow from the overlying Sandstone aquifer. The mid‐ Hawthorn confining unit exhibits vertical leakance ranging from 10‐4 to 10‐6 day‐1. The Mid‐Hawthorn aquifer is overlain by the mid‐Hawthorn confining unit and is consists of sandy and phosphatic limestones and dolomites interbedded with lower permeable beds of dolosilt and poorly indurated limestones (Knapp et al., 1986). This aquifer is not highly utilized in Collier County or Hendry County due to depth, low yield, and poor water quality. Transmissivities generally range from 500 ft2/day to 1,200 ft2/day, with localized values exceeding 4,000 ft2/day. The lower Hawthorn confining unit which underlies the Mid‐Hawthorn aquifer consists of poorly indurated limestone and interbedded clays, dolosilt, and carbonate muds. This confining unit exhibits vertical leakance ranging from 10‐3 to 10‐6 day‐1.

slide-5
SLIDE 5

Collier Resources Company Groundwater Flow Model

092214 October 2014

3

The semi‐confined Lower Hawthorn aquifer consists of fossiliferous limestone with minor amounts of silt and sand. This aquifer exhibits highly variable transmissivities ranging from 1,800 ft2/day to 12,500 ft2/day. Groundwater use from this aquifer in Collier County is very limited due to the depth of the aquifer and high chloride concentrations representative of poor water quality.

Section 3.0 Groundwater Flow Model Design

The quasi‐three dimensional flow model explicitly represents the aquifers of the Surficial and Intermediate Aquifer systems; however, the confining units separating the aquifers are implicitly represented using leakance coefficients. The aquifer model layers and implicitly modeled confining units are presented on Figure 3. This approach is commonly used to model multi‐aquifer flow systems because the additional layers and cells required for confining units are not required to simulate the flow system and simulations run more efficiently because they require less space and memory. The model simulates the natural flow system using hydraulic boundaries and aquifer parameters from both models and pumpage from nearby potable well fields were updated. Since the LWCSAS model is regional in horizontal extent, model boundaries were taken from the smaller western Collier model. Recent hydraulic boundaries identified to exist in the vicinity of the site that could potentially affect groundwater flow patterns were also included in the current model. The model was calibrated to

  • bserved heads in the vicinity of the site, from the LWCSAS report.

Subsequently, a localized model was created via telescopic mesh refinement to improve the resolution

  • f the flow system.

Section 4.0 Groundwater Flow Model Construction

The groundwater flow model was constructed with Groundwater Vistas MODFLOW 88/96 code which is consistent with both models from which the current model was constructed. By using this model, input files and parameters, as used in the LWCSAS and Western Collier County models could be imported without modifications. The LWCSAS was not constructed with a USGS or private domain graphical user interface capable of working with the Utility Generation (UGEN) Package used to create transient boundary conditions; therefore this model was not considered sufficiently flexible to address the purpose of this modeling effort. In addition, this model was constructed in 2006 and would have required updating municipal pumping files and the addition of a borrow lake. This modeling effort consisted of the construction of a regional model with the design characteristics described above. The model domain, representing an area of approximately 400,500 feet by 400,500 feet, is presented on Figure 4. The model consists of five layers and the finite difference grid consists of 176 rows and 176 columns. Row spacing (delta‐y) ranges from 500 ft to 4,531 ft and column spacing (delta‐x) ranges from 500 ft to 4,500 ft, which amounts to a total of 154,880 cells. The expanded part of the grid in the vicinity of the Collier‐Hogan well is presented on Figure 5. The Gulf of Mexico was represented as a constant head model boundary with an elevation of sea‐level in layer 1. Layers 2

slide-6
SLIDE 6

Collier Resources Company Groundwater Flow Model

092214 October 2014

4

through 4 were represented with a similar boundary, with the exception that this boundary was moved seaward compared to the position of the boundary in layer 1. Because natural regional groundwater flow is generally westward, specified head boundaries were set along the eastern side of the model. The specified heads were set with a linear hydraulic gradient with decreasing heads from north to south. These heads essentially represent the calibrated modeled heads generated for each layer of the Western Collier County model (Bennett, 1992). This type head was used to achieve a steady state solution for the regional flow system. In addition, these boundaries are sufficiently distant from the site and Collier County municipal wellfields to minimize potential boundary effects. The northern and southern sides of the model were set as no flow boundaries. Hydraulic parameters for layers 1 through 3, including hydraulic conductivity and storativity, are variable and were obtained from the LWCSAS model input parameter files provided with the model when purchased from the SFWMD. Figures depicting the distribution of these parameters are provided in the LWCSAS model report. This report is also available on‐line at the SFWMD website (http://www.sfwmd.gov/portal/page/portal/xweb%20‐ 20release%203%20water%20supply/ground%20water%20modeling). Hydraulic parameters for layers 4 and 5 were taken from the Western Collier County model (Bennett, 1992). The variable distribution of the parameters were preserved by creating additional input files for hydraulic conductivity, vertical conductance, and storage coefficients. Only major surface water bodies, including Lake Trafford and canals that affect groundwater flow in the vicinity of the site were represented. Lake Trafford, represented using the River Package, was assigned a stage elevation of 20 ft National Geodetic Vertical Datum (NGVD) and a bottom elevation of ‐3 ft

  • NGVD. This is one of the acceptable approaches that can be used with MODFLOW to represent surface

water bodies. The advantage of this approach is that groundwater is allowed to flow out of the bottom at a rate dependent on the assigned hydraulic conductivity of the bottom sediments. In addition, groundwater will flow into the lake when the stage elevation is less than the adjacent groundwater elevation, which is the case for average annual conditions. Three major canals adjacent to the site, trending north to south, were represented as drains using the Drain Package. The stage elevations along the length of these drainage canals were obtained from the Western Collier model and used to create these features with linear hydraulic gradients. Canal 1, located southwest of the Collier‐Hogan well, was assigned upgradient and downgradient stage elevations of 15.7 ft and 2.0 ft NGVD, respectively, to establish a linear hydraulic gradient. Canal 2, located southeast of the Collier Hogan well was assigned upgradient and downgradient stage elevations of 18.1 ft and 2.0 ft NGVD, respectively, to establish the hydraulic gradient. Canal 3, located west of canal 2 was assigned elevations of 15 ft and 2 ft NGVD to establish the hydraulic gradient.

slide-7
SLIDE 7

Collier Resources Company Groundwater Flow Model

092214 October 2014

5

All of these features are in both the LWCSAS and Western Collier County model, with the exception of a recent lake created by a mining excavation. The lake is located west of and adjacent to the north end of Canal 1 and has dimensions of 4,950 ft (north‐south) by 1,500 ft (east‐west). The Lake was also represented with the River Package using a constant stage elevation of 15.5 ft NGVD and a bottom elevation of 5 ft NGVD. The following municipal wellfields and modeled rates in gallons per minute (gpm) obtained from the Collier County Growth Management Plan Ammendment‐2010 were included in the model: 1) Immokalee Wellfield (SFWMD Permit 11‐00013‐W), 2339 gpm; 2) Orangetree Wellfield (SFWMD Permit 11‐00419‐W), 596 gpm; 3) Ave Maria Wellfield (SFWMD Permit 11‐02298‐W), 876 gpm; 4) Florida Governmental Utility Authority Golden Gate City Wellfield (SFWMD Permit 11‐00148‐W), 1334 gpm; 5) Collier County Utilities Golden Gate Wellfield (SFWMD Permit 11‐00249‐W), 18,998 gpm; 6) City of Naples Coastal Ridge Wellfield (SFWMD Permit 11‐00017‐W, 12,806 gpm; 7) City of Naples East Golden Gate Wellfield (SFWMD Permit 11‐00017‐W), 13085 gpm; 8) Port of the Islands Wellfield (SFWMD Permit 11‐00372‐W), 381 gpm; and 9) Everglades City Wellfield (SFWMD Permit 11‐00160‐W), 201 gpm. The model was run as a steady state solution to represent average conditions using the Pre‐Conditioned Conjugate Gradient (PCG2) solver to calculate advective flow from the three‐dimensional matrix of partial differential equations. The settings used with this solver included maximum inner and outer iterations of 25 and 100, respectively. Head change criterion was 0.001 ft, residual criterion for convergence was 1, and the relaxation parameter was 1. The Cholesky matrix pre‐conditioning method was used for model solution. Model input and output files are included in Appendix A, on an attached compact diskette. Section 5.0 Groundwater Flow Model Simulation The groundwater flow model simulation results depicting the flow system in the vicinity of the site are presented on Figure 6. These results were generated using the regional flow model. The part of the regional model in the vicinity of the site was subsequently isolated and converted to a TMR model. The flow system results from the steady state TMR simulation are presented on Figure 7. Both flow systems indicate that groundwater flow is generally to the south‐southwest and is controlled by the borrow lake and the drainage canals located south of the Collier‐Hogan well. This simulation represents high groundwater elevations that would be associated with the annual summer rainfall period. The hydraulic gradient during summer wet season would be expected to be greater than the dry season; therefore these results are conservative and represent conditions when groundwater velocities would be greater.

Section 6.0 Solute Transport Model Design

Solute transport was conducted with the USGS particle‐tracking model MODPATH (Pollock, 2012). MODPATH calculates three‐dimensional flow paths using output flow field from a MODFLOW

slide-8
SLIDE 8

Collier Resources Company Groundwater Flow Model

092214 October 2014

6

  • simulation. The program uses a semi‐analytical particle‐tracking scheme using an analytical expression
  • f a particle's flow within each finite‐difference grid cell to simulate flow by advection. MODPATH does

not represent sorption, decay, and hydrodynamic dispersion; therefore, the estimates are considered

  • conservative. Unlike typical solute transport models that are based on the advection‐dispersion

equation and take into consideration characteristics of the dissolved phase, MODPATH calculates the path and velocity of a particle of water or conservative dissolved phase from the MODFLOW flow field. In graphical format, MODPATH provides estimated pathlines and travel times from the point of release to downgradient receptors, such as a hydraulic sink, at which time the particle is removed from the

  • model. MODPATH provides insight into the migration of potential impacts by advection only, which is

generally responsible for the bulk migration of impacts to an aquifer.

Section 7.0 Solute Transport Model Construction

Three particles were set up within a circle with a radius of 64 ft in the immediate vicinity of the oil well, to simulate potential impacts to the water table aquifer. Since MODPATH calculates linear velocity as part of its solution of pathlines and travel time, an estimate of effective porosity was required. The LWCSAS includes an effective porosity of 20% in MODFLOW; however a more conservative effective porosity of 15% was used for the MODPATH simulation for this study.

Section 8.0 Solute Transport Model Simulation

The particle tracking path that a hypothetical dissolved conservative compound would follow from the vicinity of the oil well is presented on Figure 6 and Figure 7. The results indicate that a conservative contaminant particle released at present would migrate horizontally to the south‐southwest approximately 1500 ft within ten years or approximately 0.4 ft/day, without migrating to the deeper Lower Tamiami aquifer that underlies the water table aquifer. The hypothetical plume is shown in Figure 8.

Section 9.0 Discussion and Conclusions

This modeling effort was performed to identify the potential risks associated with a surface release of chemical products used by the oil industry during well construction and operation. The groundwater flow model simulated the local groundwater flow system in the vicinity of the site. Although the model is regional in extent, the primary interest is in the near vicinity of the Collier‐Hogan well. The groundwater flow direction in the vicinity of the oil well is generally south‐southwest; however, the borrow lake and the two drainage canals located downgradient from the oil well are hydraulic sinks and cause groundwater to flow towards these features. The regional model simulates the Collier County municipal wellfields, which significantly control groundwater flow farther downgradient from the oil

  • well. The closest municipal wellfield to the oil well is the Orangetree wellfield; however, given the 10‐

year travel time required for a particle to flow 1,500 ft from the well, it is unlikely that a potential

slide-9
SLIDE 9

Collier Resources Company Groundwater Flow Model

092214 October 2014

7

surface impact to the water table aquifer would be captured by any of the municipal wellfields located six miles away, even over timeframes much larger than 10 years. The hydraulic conductivities and transmissivities in the surficial aquifer appear to be one to two orders

  • f magnitude higher than values measured by CRA within the modeled area. Therefore, the 1,500 feet

particle track is a worst‐case scenario that likely dramatically overestimates the flow path distance by at least one order of magnitude due to the assumption of high conductivities. Using actual hydraulic conductivity and transmissivity data from sites in the general area, the likely travel distance would be less than 150 feet in the ten‐year time period, especially considering dispersion, dilution, and other forms of attenuation were not considered. Given that the goal of this modeling effort was to estimate the likelihood of a hypothetical accidental release of acid‐stimulation fluid near the oil well reaching the nearest wellfield six miles away, this level of analysis is sufficient. That is, in the worst case, the groundwater will travel only 1,500 feet not six miles (as shown on Figure 8). A more refined and realistic model using site‐specific data is likely to indicate a hypothetical salt water plume that is considerably shorter (i.e., less than 150 feet) in the same travel time due to lower hydraulic conductivities and dispersion. It should be emphasized that the particle‐tracking solute transport modeling conducted is very conservative because typical factors that decrease contaminant concentrations and migration (e.g., sorption, dispersion, and decay) were not simulated. That is, the model assumed an infinite source of maximum concentration for the entire 10‐year period. The most likely scenario, if a spill had occurred, would be a finite source that would attenuate over time with only residual concentrations remaining in the vicinity of the hypothetical spill (i.e., less than approximately 150 feet). The potential risks to private and municipal water supplies even over large timeframes from a potential surface release in the vicinity

  • f the Collier‐Hogan oil well are minimal.
slide-10
SLIDE 10

Collier Resources Company Groundwater Flow Model

092214 October 2014

Figures

slide-11
SLIDE 11

Collier-Hogan Well

DESIGNED: PROJECT #: DRAWN: CHECKED: CAD FILE: DATE:

BH RLG October 9, 2014 SITE: 1

FIGURE:

SHEET TITLE

Collier-Hogan Oil Well

Immokalee Road, Naples, Collier County, Florida Site Map

9110 College Pointe Court, Fort Myers, FL 33919 Tel: (239)936-4003

092214

Groundwater Flow Model

slide-12
SLIDE 12

DESIGNED: PROJECT #: DRAWN: CHECKED: CAD FILE: DATE:

BH RLG October 9, 2014 SITE: 2

FIGURE:

SHEET TITLE

Collier-Hogan Oil Well

Immokalee Road, Naples, Collier County, Florida Hypothetical Surface Spill Plume Map*

9110 College Pointe Court, Fort Myers, FL 33919 Tel: (239)936-4003

092214

Groundwater Flow Model

General hydrogeologic cross-section of Collier County (Bennett, 1992)

slide-13
SLIDE 13

DESIGNED: PROJECT #: DRAWN: CHECKED: CAD FILE: DATE:

BH RLG October 9, 2014 SITE: 3

FIGURE:

SHEET TITLE

Collier-Hogan Oil Well

Immokalee Road, Naples, Collier County, Florida

9110 College Pointe Court, Fort Myers, FL 33919 Tel: (239)936-4003

092214

Groundwater Flow Model of the Surficial and Intermediate Aquifers in the Vicinity of the Collier-Hogan Oil Well

Groundwater Flow Model

Hydrogeologic units and model layers (Bennett, 1992)

slide-14
SLIDE 14

Model Domain, Grid, and Boundaries

DESIGNED: PROJECT #: DRAWN: CHECKED: CAD FILE: DATE:

BH RLG October 9, 2014 SITE: 4

FIGURE:

SHEET TITLE

Collier-Hogan Oil Well

Immokalee Road, Naples, Collier County, Florida

9110 College Pointe Court, Fort Myers, FL 33919 Tel: (239)936-4003

092214

Groundwater Flow Model

slide-15
SLIDE 15

DESIGNED: PROJECT #: DRAWN: CHECKED: CAD FILE: DATE:

BH RLG October 9, 2014 SITE: 5

FIGURE:

SHEET TITLE

Collier-Hogan Oil Well

Immokalee Road, Naples, Collier County, Florida

9110 College Pointe Court, Fort Myers, FL 33919 Tel: (239)936-4003

092214

Groundwater Flow Model

Expanded Grid in Vicinity of Site

Expanded Grid in Vicinity of Site

slide-16
SLIDE 16

DESIGNED: PROJECT #: DRAWN: CHECKED: CAD FILE: DATE:

BH RLG October 9, 2014 SITE: 6

FIGURE:

SHEET TITLE

Collier-Hogan Oil Well

Immokalee Road, Naples, Collier County, Florida

9110 College Pointe Court, Fort Myers, FL 33919 Tel: (239)936-4003

092214

Groundwater Flow Model

Simulated Particle Tracking Path

Simulated Groundwater Flow System And Particle Tracking Paths In Surficial Aquifer

slide-17
SLIDE 17

DESIGNED: PROJECT #: DRAWN: CHECKED: CAD FILE: DATE:

BH RLG October 9, 2014 SITE: 7

FIGURE:

SHEET TITLE

Collier-Hogan Oil Well

Immokalee Road, Naples, Collier County, Florida

9110 College Pointe Court, Fort Myers, FL 33919 Tel: (239)936-4003

092214

Groundwater Flow Model

TMR Model Showing Groundwater Flow System and Particle Paths

slide-18
SLIDE 18

DESIGNED: PROJECT #: DRAWN: CHECKED: CAD FILE: DATE:

BH RLG October 9, 2014 SITE: 8

FIGURE:

SHEET TITLE

Collier-Hogan Oil Well

Immokalee Road, Naples, Collier County, Florida Hypothetical Surface Spill Plume Map*

9110 College Pointe Court, Fort Myers, FL 33919 Tel: (239)936-4003

092214

*Hypothercital plume assuming infinite source

Groundwater Flow Model of the Surficial and Intermediate Aquifers in the Vicinity of the Collier-Hogan Oil Well

Groundwater Flow Model