
SLIDE 1
1
1 Forward-Looking Statements The following presentation contains - - PowerPoint PPT Presentation
1 Forward-Looking Statements The following presentation contains forward looking statements within the meaning of the Private Securities Litigation Reform A ct of 1995. Forward-looking statements are not based on historical facts but instead
1
2 The following presentation contains “forward looking statements” within the meaning of the Private Securities Litigation Reform Act of 1995. Forward-looking statements are not based on historical facts but instead reflect our expectations concerning future results or events, including our expectations for our spin-off of the household products business, our growth, new product launches and strategic initiatives, including restructurings, and our outlook for future financial, operational or
are difficult to predict and could cause our actual results, performance or achievements to differ materially from those expressed in or indicated by those statements. The forward-looking statements included in this presentation are only made as of the date of this document and we disclaim any obligation to publicly update any forward-looking statement to reflect subsequent events or circumstances. Numerous factors could cause our actual results and events to differ materially from those expressed or implied by forward-looking statements, including:
and does not disrupt our business operations;
employees, customers and vendors; In addition, other risks and uncertainties not presently known to us or that we consider immaterial could affect the accuracy of any such forward-looking statements. The list of factors above is illustrative, but by no means exhaustive. All forward-looking statements should be evaluated with the understanding of their inherent
the year ended September 30, 2014 and the Form 10-Q for the quarter ended December 31, 2014..
Forward-Looking Statements
3
Trademarks and Brands We use “Energizer” and the Energizer logo as our trademarks. Product names and company programs appearing in this presentation are trademarks of Energizer Holdings, Inc. or its subsidiaries. This presentation also may refer to brand names, trademarks, service marks and trade names of other companies and organizations, and these brand names, trademarks, service marks and trade names are the property of their respective owners. Market and Industry Data Unless we indicate otherwise, we base the information concerning our industry contained in this presentation on our general knowledge of and expectations concerning the industry. Our market position and market share are based on our estimates using data from various industry sources and assumptions that we believe to be reasonable based on our knowledge of the industry. We have not independently verified data from industry sources and cannot guarantee its accuracy or completeness. In addition, we believe that data regarding the industry and our market position and market share within such industry provides general guidance but is inherently imprecise. Regulation G – Non-GAAP Financial Measures For full reconciliation of non-GAAP financial measures, visit www.energizerholdings.com About Energizer, Investor Relations, Presentations
4
Ward Klein
Chief Executive Officer
5
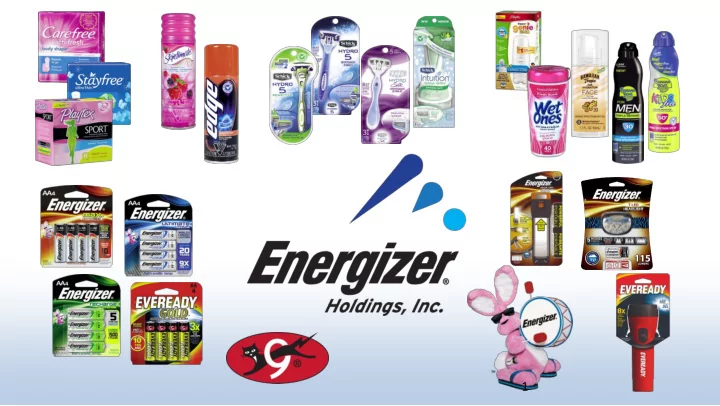
Energizer Holdings, Inc.
$1.9 billion
$436 million
$21.25
SPUN-OFF FROM RALSTON PURINA IN MARCH 2000 Fiscal Year Ending September 30, 2000
6
Financial Strategy
– SWS - utilize strong cash flows from battery and diversify into global categories that respond to innovation – Playtex – portfolio of #1 and #2 brands that expanded personal care holdings and leveragable scale – Edge - #1 shave prep brands in North America, strong commercial synergies – ASR - leading private label razor and blade manufacturer in the world – J&J FemCare - North America feminine pads and liners. Combined with PYX tampons creates a strong fem care business in North America
7
Financial Strategy
– Opportunistically repurchased 56.8 million shares at an average price
– Initiated a dividend policy with total payments of $286 million
8
EHI – Financial Results
0.5 1 1.5 2 2.5 3 3.5 4 4.5 5 2000 2014
Net Sales
$1.9 billion $4.4 billion
Over $3 billion in Cash Returned to Shareholders
Billions
Net Sales 6.2% Segment Profit 5.6% Adjusted EPS 11.0% TSR 12.5% CAGR
9
Why Split
10
Separation Objectives
– Strong capital structures – Positive business momentum in both businesses
11
Separation Status
– Two comparably sized companies integrated outside the U.S. – Companies in over 50 countries, 6 continents – Restructuring, as a part of the spin, to right size the global footprint
12
Separation Status
– Announced April 30, 2014 – Geographic footprint defined – Leadership selected in 2014 – Form 10 filed on February 6, 2015 – Capital Structure to be finalized by May – Investor meetings planned for June – Split targeted for July 1, 2015
13
Introduction of New CEO’s
14
David Hatfield
CEO of Remain Co, existing Personal Care business:
– Executive Vice President and Chief Marketing Officer, Energizer Battery from 2004 to 2007 – Vice President, North American and Global Marketing, from 1999 to 2004
15
Alan Hoskins
CEO of Spin Co, existing Household Products business:
– Vice President, Asia-Pacific, Africa and Middle East 2008 to 2011 – Vice President, North America Household Products Division from 2005 to 2008
PERSONAL CARE
David Hatfield, CEO
16
Energizer Personal Care: Who We Are
Leading pure-play personal care
company
Presence in attractive categories
—Wet shave —Sun care —Feminine care —Infant care
Multi-national; Strong position
in large and developed markets
1 For the Fiscal Year Ended 9/30/2014.Business Mix1 Revenue: $2.6 billion
61% 16% 16% 5% 2% Wet Shave Sun and Skin Care 60% 18% 13% 7% 2% US & Canada EMEA Asia Latin America Feminine Care Infant Care Other Other 17
We Operate in Attractive Consumer Categories
Global categories forecasted to grow (Euromonitor FY13-16)
—Wet Shave: +2% —Sun care +4%
US Categories rebounding recently (Nielsen 1/10/15)
Manual Shave Sun Care Fem Care Shave Preps Baby Care Total EPC Categories
L12W
4.9% 1.1% 3.7% 2.8% 1.2% L52W
0.4% 1.2%
18
We Have Strong Brands and Competitive Positions
Category Brands Key Geographies Rank Wet Shave
US, Canada, Japan,
Germany #2 Globally Sun and Skin Care
US, Mexico, Australia
#1 Feminine Care1
US and Canada
#2,3 Infant Care
US and Canada
#1
1 #2 market share position of total tampons and #2 or #3 in liners and pads : US and Canada Nielsen 1/10/1519
Organic growth and M&A have fueled topline over time
500 1000 1500 2000 2500 3000 2003 2004 2005 2006 2007 2008 2009 2010 2011 2012 2013 2014
Net Sales
20
Leadership Team Brings Experience and Continuity
Executive Chairman of the Board: Ward Klein — Brings 35+ years of experience in the consumer products industry, including 10 years of experience as the CEO of Energizer Holdings. He has overseen EPC since 2004. CEO: David Hatfield — Brings 29 years of experience in the consumer products industry, primarily in marketing, global and strategic management roles. He has served as CEO of EPC since 2007. CFO: Sandy Sheldon — Brings 29 years of experience at Energizer and Ralston Purina and is currently serving as the VP Finance for Energizer Holdings. She has served in EPC since 2004 and as VP Finance, EPC has been instrumental in all of its acquisitions including Schick-Wilkinson Sword. Leadership team — Diverse team with extensive CPG experience. — 7 of 9 have been with EPC since before 2007.
21
Looking Forward- Mission Remains:
22
23
Edgewell: Value Drivers
24
– Meaningful Investment against Growth Brands – Maintain Strong Innovation Roadmap – Leverage Full Product Portfolio – Continue International Expansion
Edgewell: Value Drivers
25
– Meaningful Investment against Growth Brands – Maintain Strong Innovation Roadmap – Leverage Full Product Portfolio – Continue International Expansion
Edgewell: Value Drivers
26
Edgewell Value Drivers: Innovation
$- $50 $100 $150 $200 $250 $300 $350 $400 $450
12 Months ended Nov. 2012 12 Months ended Nov. 2013 12 Months ended Nov. 2014Hydro Franchise Retail Sales (US$ Million)
Men's Women's Disposables
$298 $375 $405
Source: AC Nielsen Global Track, 28 Markets Launch Sensitive Launch Sensitive & Groomer Launch Power Select Launch 27
Introducing Playtex Sport Pads and Liners
28
Introducing Playtex Sport Combo Packs- highly unique and appealing to consumers
Source: Nielsen BASES II, 2014“I like that everything I need would be in one box and it would fit my active life.’” Tampons+ Pads Tampons+ Liners “I love the combo pack. That is incredibly unique, and I usually need to use both during my cycle ”
29
Innovation Drives Razor and Blade Core Brands in F15
The only 2-in-1 razor and trimmer! Launching in North America and Asia Pacific Trade up with our best X3 performance ever. Launching in North America, Asia Pacific and Europe A citrus infused scent brings the revitalizing trend to the Intuition
North America, Japan
30
Sun Care 2015 New Products
New! 2 SKUs The only product to offer a ‘sand brushes off easily’ benefit Upgrade: 5 SKUs Now with PowerStay technology Upgrade: 4 SKUs Now with Argon Oil New! 4 SKUs Uniquely brings indulgent sun care into the Sport segment New! 2 SKUs Instant natural looking color Upgrade: 2 SKUs Not only protects, but now also softens and leaves skin radiant31
– Meaningful Investment against Growth Brands – Maintain Strong Innovation Roadmap – Leverage Full Product Portfolio – Continue International Expansion
Edgewell: Value Drivers
32
Leverage Full Portfolio
Blade Count / Performance Price
33
– Meaningful Investment against Growth Brands – Maintain Strong Innovation Roadmap – Leverage Full Product Portfolio – Continue International Expansion
Edgewell: Value Drivers
34
Markets
Developing Markets
in developing markets with renewed focus on investment and channel strategy
International Expansion and Growth
Developing Markets Growth1
7.0% 17.0% 9.0%
0% 5% 10% 15% 20% 25% Shave Sun EPC
Net Sales CAGR 2008 - 2014
1 Represents Net Sales CAGR from 2008 – 2014 for Asia + Latin America, excluding Japan, Australia, Argentina, Venezuela.35
Edgewell: Value Drivers
36
Edgewell: Value Drivers
37
Edgewell: Value Drivers
38
Substantial free cash flow to enable investments and capital return
100 200 300 400 500 600 2003 2004 2005 2006 2007 2008 2009 2010 2011 2012 2013 2014 Segment Profit ($mm)
39
HOUSEHOLD PRODUCTS
Alan Hoskins, CEO
40
We’re well positioned to deliver value to shareholders
Strong foundation to build on for the future Good momentum heading into our spin-off Focused on delivering long-term shareholder value
41
Our business is built on strong global, iconic brands
brands in category
billions of consumers around the world … brands consumers know and love
equities to new products/licensing options
42
Our broad portfolio of products by brand and segment
Established Broad Product Portfolio Uniquely positioned brands and product portfolio to compete in all consumer segments
43
Our Energizer and Eveready brands are #1 or #2 globally
Source: Combined value share data from Nielsen Global Track, 52-weeks ending November 2014, including all Energizer and Eveready branded batteries.Our products are sold in over 140 markets around the world
Value share in country USA=32% CAN=39% MEX=30% COL=41% ARG=54% MAL=75% AUS=71% NZL=72% SING=77% KOR=47% HK=41% GB=21% FRA=27% ITA=30% GRE=56% EGP=82%
49 51
Household Products Net Sales (2014, % of net sales) Household Products Segment Profit (2014, % of net sales)59 41
North America Rest of World44
2% 3% 3% 4% 5% 7% 13% 18%
Radio Health** Wireless Mouse Digital Cameras Smoke Alarms, Clocks Flashlights etc Remote Controls Toys, GamesBattery category driven by devices and demographics
*Source: 2014 TNS US Device Study, **Health = hearing aids and electronic toothbrushes *2Battery Consumption represents Total # Batteries Required per device divided by Total # Batteries Required by all devices Base: All household battery-powered devicesLarge Installed Base of Over 1 Billion Devices*
Top 20 Devices = ~55% of Battery Consumption
Emerging Device Categories
Home Automation Medical Fitness
45
We create joint value for our channel partners
largest and most profitable at retailers
than 80% of all U.S. households
and are a basket builder for retailers
46High Household Penetration Basket Builder Profitable Large Scale
46
We generate meaningful free cash flow
Working Capital
Requirements
5.2 6.2 6.3 7.2 7.4 9.8 10.4 12.6 14.0
5 10 15 Peer 8 Peer 7 Peer 6 Peer 5 Peer 4 Peer 3 Peer 2 EHP* Peer 1
Energizer Household Products Free Cash Flow % Sales
(prior fiscal three-year average)
Source: ENR and peer SEC filings , *EHP = Energizer Household Products Note: Peers comprised of the following household products companies (in alpha order): CHD, CLX, HELE, NWL, SMG, SPB, TUP, WD4047
We’re well positioned to deliver value to shareholders
Strong foundation to build on for the future Good momentum heading into our spin-off Focused on delivering long-term shareholder value
48
Three core strategies focused on delivering value Reinvest in the Business
Lead Innovation Operate with Excellence Drive Productivity Gains
49
Leader in innovation with a history of world’s “firsts” … with more to come in the future
Energizer Max with Power Seal Technology
Long lasting and maintains superior in-device leakage protection
Energizer Ultimate Lithium
The world’s longest-lasting AA and AAA batteries in high-tech devices
Energizer EcoAdvanced
The world's first AA battery made with 4% recycled batteries and our longest-lasting alkaline launched 2/3/15
50
We’ve increased investment behind our brands
and supporting innovation are critical components of
5.3% 6.3% 6.6%
2012 2013 2014
Household Products Global Advertising & Promotion Spend (as % of Sales)
51
We’re building our business via quality distribution and investment in effective category fundamentals
Optimize our broad, diversified distribution Maximize visibility, location and mix in the store
Sporting Goods Online DIY Hobby/ Craft
ConvenienceOffice Auto Home Center Dollar Club Food/ Drug/ Mass
Traditional Trade
Military
Energizer
52
We’ve significantly reduced working capital to improve cash flow
requirements by 10.2 percentage points since 2011, essentially freeing up over $185 million in cash
in DSO and DPO
Household Products Working Capital as a % of Sales (average trailing four quarters)
12.7% 15.8% 20.0% 22.9% 0.0% 5.0% 10.0% 15.0% 20.0% 25.0% 2014 2013 2012 2011
53
We continue to drive productivity gains to enhance our strong margins
footprint
chain
purchasing function
streamlined product portfolio and centralized the marketing organization
2011 2012 2013 2014 41.9% 46.2%
Household Products Gross Margin
(% of sales)
Through FY14
Household Products Restructuring Savings
(in $ millions) + 90 bps + 200 bps
$185 $200
54
We’re well positioned to deliver value to shareholders
Strong foundation to build on for the future Good momentum heading into our spin-off Focused on delivering long-term shareholder value
55
Seasoned executive team with a wealth of experience
– Brings 40+ years of experience in the consumer products industry, and 20 years of experience as the former CEO of the battery business. He has served as Chairman of the Board of Energizer Holdings since 2007.
– Brings 33 years of experience at Energizer, with a wealth of global sales, marketing and operational experience. Alan previously led the North America and Asia-Pacific
– Brings 17 years of experience in the consumer products industry, currently serving as the Controller and Chief Accounting Officer. Led the enterprise-wide restructuring effort and was a driving force behind the Working Capital improvement initiative.
– Diverse team with extensive global battery and CPG experience.
56
As we prepare for the spin-off, we are focused on …
core strategies
adjust to the future strategies and scale of the business
increase efficiencies
activities
improvements
57
(ENR)
We will be prudent stewards of capital
Maximize Free Cash Flow Reinvest in
business Return of capital Selective, Disciplined M&A Deliver VALUE
Our Foundation Pillars to our Success Relentless focus on delivering value to
colleagues
58
We’re well positioned to deliver value to shareholders
Strong foundation to build on for the future Good momentum heading into our spin-off Focused on delivering long-term shareholder value
59
60
61