
SLIDE 1
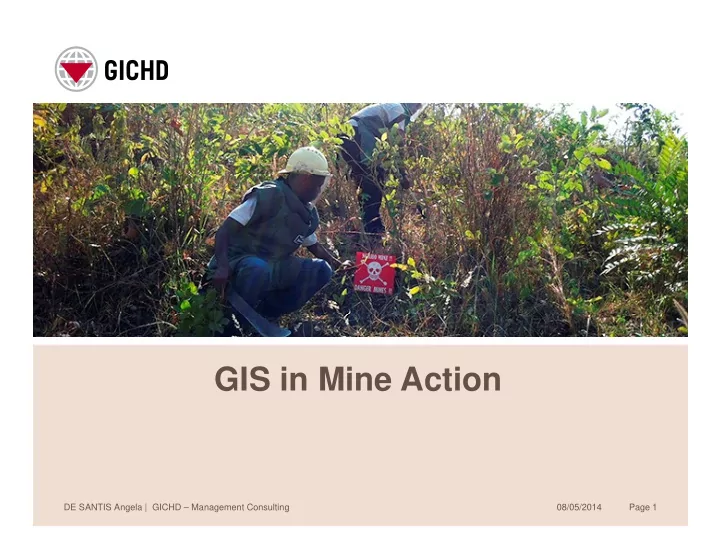
GIS in Mine Action GIS in Mine Action
Page 1 DE SANTIS Angela | GICHD – Management Consulting 08/05/2014
GIS in Mine Action GIS in Mine Action DE SANTIS Angela | GICHD - - PowerPoint PPT Presentation
GIS in Mine Action GIS in Mine Action DE SANTIS Angela | GICHD Management Consulting 08/05/2014 Page 1 Five pillars of Mine Action Humanitarian Advocacy Mine Risk Education Victim Assistance Victim Assistance Stockpile Destruction
Page 1 DE SANTIS Angela | GICHD – Management Consulting 08/05/2014
Page 2 DE SANTIS Angela | GICHD – Management Consulting 08/05/2014
Page 3 DE SANTIS Angela | GICHD – Management Consulting 08/05/2014
Page 4 DE SANTIS Angela | GICHD – Management Consulting 08/05/2014
INFRASTRUCTURES POPULATION DISTRIBUTION VEGETATION
SHA / CHA
TERRAIN
Page 5 DE SANTIS Angela | GICHD – Management Consulting 08/05/2014
Page 6 DE SANTIS Angela | GICHD – Management Consulting 08/05/2014
Representation of every hazardous area
Representation of every hazardous area by a polygon delimiting its boundaries, and/or by a point symbol marker at its central XY coordinates
Page 7 DE SANTIS Angela | GICHD – Management Consulting 08/05/2014
Page 8 DE SANTIS Angela | GICHD – Management Consulting 08/05/2014
Page 9 DE SANTIS Angela | GICHD – Management Consulting 08/05/2014
Page 10 DE SANTIS Angela | GICHD – Management Consulting 08/05/2014
Page 11 DE SANTIS Angela | GICHD – Management Consulting 08/05/2014
Page 12 DE SANTIS Angela | GICHD – Management Consulting 08/05/2014
Page 13 DE SANTIS Angela | GICHD – Management Consulting 08/05/2014
Page 14 DE SANTIS Angela | GICHD – Management Consulting 08/05/2014
Page 15 DE SANTIS Angela | GICHD – Management Consulting 08/05/2014
Page 16 DE SANTIS Angela | GICHD – Management Consulting 08/05/2014
Page 17 DE SANTIS Angela | GICHD – Management Consulting 08/05/2014
Page 18 DE SANTIS Angela | GICHD – Management Consulting 08/05/2014
Page 19 DE SANTIS Angela | GICHD – Management Consulting 08/05/2014
Page 20 DE SANTIS Angela | GICHD – Management Consulting 08/05/2014
Low difficulty Medium difficulty High difficulty Very High difficulty
POPULATION DISTRIBUTION INFRASTRUCTURES DISTRIBUTION VEGETATION
SHA / CHA
TERRAIN
Page 21 DE SANTIS Angela | GICHD – Management Consulting 08/05/2014
Page 22 DE SANTIS Angela | GICHD – Management Consulting 08/05/2014
Page 23 DE SANTIS Angela | GICHD – Management Consulting 08/05/2014
Page 24 DE SANTIS Angela | GICHD – Management Consulting 08/05/2014