SLIDE 1
Geotechnical Evaluation of a Small Levee System for FEMA Certification
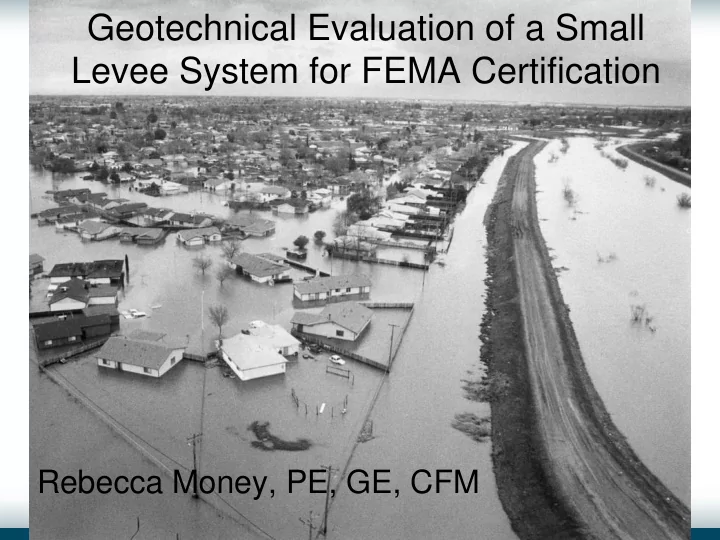
Rebecca Money, PE, GE, CFM
SLIDE 2
Purpose
Provide an overview and an understanding for Cities/Counties/Districts of what it takes from a Geotechnical Engineering perspective to prepare a levee system for certification.
SLIDE 3
Introduction
Client: Sacramento Area Flood Control Agency (SAFCA) North Area Streams Study Area located just north of Sacramento, California Included five levee segments:
Dry Creek right and left bank levees (3.8 miles) Arcade Creek right and left bank levees (4.2 miles) Natomas East Main Drainage Canal (NEMDC) east bank levee (3.9 miles)
SLIDE 4
Site Location
SLIDE 5
Background
SAFCA tasked with certifying these levees by 2020 Kleinfelder reviewed multiple levee systems to identify areas of concern
SLIDE 6
Background – Phase 1
Phase 1:
Data collection and Geotechnical Data Report
Phase 2:
Engineering Evaluation and Problem Identification Report
Phase 3:
Final Design and/or Levee Certification
SLIDE 7
Introduction
Levee: Dry Creek right and left bank levees Length: Left bank levee 2.2 miles, right bank levee 1.6 miles Waterways: Dry Creek and Robla Creek
SLIDE 8
Phase 1
SLIDE 9
Existing Information
Explorations: NAS Total
145 borings 49 CPTs
Explorations: Dry Creek Only
47 borings 18 CPTs Depths were mostly shallow
Not Sufficient (depth and spacing)
SLIDE 10
Existing Information
Sampling and Laboratory Testing
Most borings had 5’ sample intervals Lab testing included:
Index and strength testing
Not Sufficient (quantity and depth)
SLIDE 11 Existing Information
Geologic Mapping Right levee
Channels, Modesto and Riverbank Formations
Left levee
Channels, Vernal Pools, Modesto and Riverbank Formations
(Fugro WLA)
SLIDE 12 Existing Information
Topographic Maps:
LiDAR Site specific ground surveys
(Fugro West)
SLIDE 13 Existing Information
HEM Survey:
Geophysical survey that evaluates changes resistivity in subsurface conditions. Typically shows differences between high resistivity (sands) and low resistivity (clays)
(Fugro Airborne Services)
SLIDE 14
Existing Information
As-Built Drawings:
1950’s USACE Construction 1995 and 1997 Construction Final Construction Reports Communication with field Geotechnical Engineer
SLIDE 15
Existing Information
Construction Inspection Reports
Geotechnical inspector was available for consultation Final construction reports detailing key trench depths
Sufficient and Invaluable
SLIDE 16
Existing Information
Past Performance:
Historic water levels Flood patrol notes Newspaper articles
SLIDE 17
Historical Water Levels
SLIDE 18
Historical High Water Marks
SLIDE 19
New Information
Levee Inspection Borings
6 borings
Lab
Moisture content, unit weight, Atterberg Limits, grain size analysis
SLIDE 20
Phase 2
SLIDE 21
Reach Selection
Levee Segments divided into reaches based on:
Subsurface conditions Past performance Construction/Remediation history Geomorphology changes Topographic features Construction features
SLIDE 22
Reach Selection
SLIDE 23
Reach Limits
SLIDE 24
Analysis Cross Section
Critical analysis cross section:
1 section per reach Based on:
Topography Stratigraphy Past performance
Representative for entire reach – Base model Sensitivity analysis performed if needed
SLIDE 25
SLIDE 26
Material Property Selection
SLIDE 27
Analysis
Engineering analysis performed to evaluate:
Levee Geometry Through Seepage Underseepage Waterside and Landside Slope Stability Settlement Seismic Evaluation
Using 100-year WSE (1-percent chance flood)
SLIDE 28 Analysis Methods
USACE guidelines were used for evaluation
- f seepage, stability, and settlement (EM
1110-2-1913, ETL 1110-2-569, and SOP SPK EDG-03) USACE process for National Flood Insurance Program (NFIP) guidance for levee system evaluation (EC 1110-2-6067) Code of Federal Regulations (44 CFR 65.10) DWR Urban Levee Design Criteria (ULDC) used for seismic
SLIDE 29
Analysis Criteria
Through seepage: water exiting the landside levee slope (daylight of phreatic surface) and presence of erodible soils Underseepage: Exit gradient less than 0.5 at landside levee toe Stability: Minimum Factor of Safety of 1.0 to 1.2 for Case II – Sudden Drawdown and 1.4 for Case III - Steady-State Seepage Condition Settlement: N/A –Proposed project does not involve new construction or modification to levee prism.
SLIDE 30 Analysis Results – Through Seepage
Layer 3, construction to raise levee and reconstruct waterside/landside slope
Watch for daylight of phreatic surface on landside levee slope
SLIDE 31
Analysis Results – Underseepage
Gradients calculated at the landside levee toe and at the bottom of any lower topography (i.e. ditches) Keyways from construction tip into hardpan
SLIDE 32
Analysis Results – Landside Stability
Landside slopes typically 2H:1V
SLIDE 33
Analysis Results – Waterside Stability
Waterside slopes typically 2.5H:1V to 4H:1V
SLIDE 34
Analysis Results – Seismic Deformation
Qualitative evaluation to estimate liquefaction potential of subsurface soils Deformation analysis performed only if soils are liquefiable under design ground motions 7 borings have potential liquefiable soils in the upper 10 feet All were thin, discontinuous layers Therefore, no deformation analysis was performed
SLIDE 35
Conclusions
Geometry – meets criteria Through Seepage – meets criteria Underseepage – met criteria in all but 1 location which was further explored in Phase 3 and determined to meet criteria Landside stability – meets criteria Waterside stability – meets criteria Seismic – additional evaluation should be performed during design based on results of qualitative evaluation
SLIDE 36
Conclusions
Phase 3 –
One outstanding area needed additional review for Dry Creek left bank levee. Additional exploration and revision to analysis confirmed it met criteria Ready for Certification Process
SLIDE 37
Thank you!