
SLIDE 1
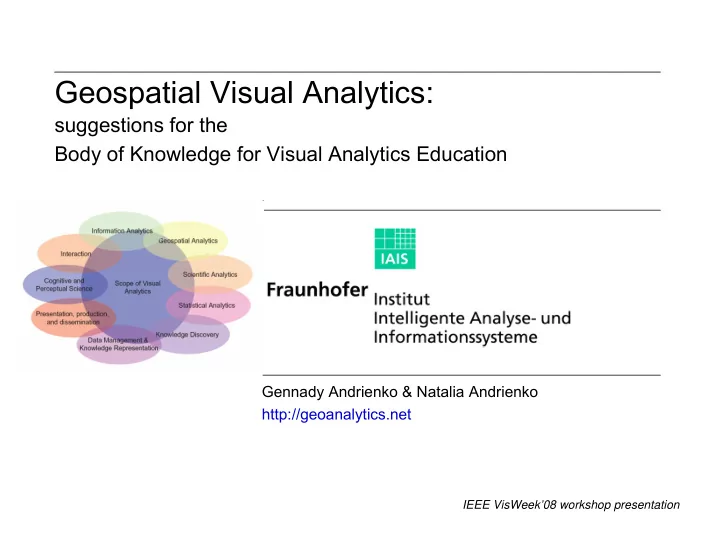
Gennady Andrienko & Natalia Andrienko http://geoanalytics.net
Geospatial Visual Analytics:
suggestions for the Body of Knowledge for Visual Analytics Education
IEEE VisWeek’08 workshop presentation
Geospatial Visual Analytics: suggestions for the Body of Knowledge - - PowerPoint PPT Presentation
Geospatial Visual Analytics: suggestions for the Body of Knowledge for Visual Analytics Education Gennady Andrienko & Natalia Andrienko http://geoanalytics.net IEEE VisWeek08 workshop presentation Outline What is special about spatial
IEEE VisWeek’08 workshop presentation
2 Gennady & Natalia Andrienko http://geoanalytics.net/and
3 Gennady & Natalia Andrienko http://geoanalytics.net/and
characteristics of spatial data
> locations (projection, etc.) > distances (elevation; constraints; alternatives) > attributes (poor models; limited samples) > time
> scale (features / processes scale dependent) > time-dependence
… of temporal data
4 Gennady & Natalia Andrienko http://geoanalytics.net/and
5 Gennady & Natalia Andrienko http://geoanalytics.net/and
6 Gennady & Natalia Andrienko http://geoanalytics.net/and
7 Gennady & Natalia Andrienko http://geoanalytics.net/and
8 Gennady & Natalia Andrienko http://geoanalytics.net/and
9 Gennady & Natalia Andrienko http://geoanalytics.net/and
10 Gennady & Natalia Andrienko http://geoanalytics.net/and
11 Gennady & Natalia Andrienko http://geoanalytics.net/and
Porto Lisboa
12 Gennady & Natalia Andrienko http://geoanalytics.net/and
13 Gennady & Natalia Andrienko http://geoanalytics.net/and
14 Gennady & Natalia Andrienko http://geoanalytics.net/and