SLIDE 1
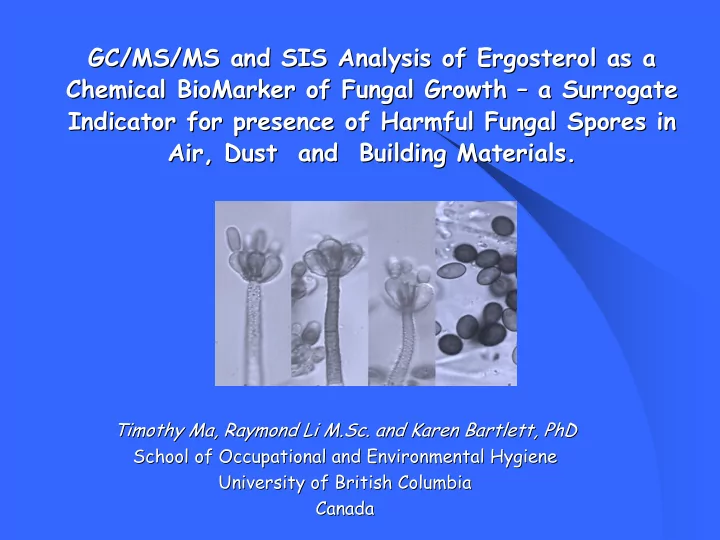
GC/MS/MS and SIS Analysis of Ergosterol as a GC/MS/MS and SIS Analysis of Ergosterol as a Chemical BioMarker of Fungal Growth Chemical BioMarker of Fungal Growth – – a Surrogate a Surrogate Indicator for presence of Harmful Fungal Spores in Indicator for presence of Harmful Fungal Spores in Air, Dust and Building Materials. Air, Dust and Building Materials.
Timothy Ma, Raymond Li M.Sc. and Karen Bartlett, PhD Timothy Ma, Raymond Li M.Sc. and Karen Bartlett, PhD School of Occupational and Environmental Hygiene School of Occupational and Environmental Hygiene University of British Columbia University of British Columbia Canada Canada
SLIDE 2 Negative Health Effects of Moulds/Fungi Negative Health Effects of Moulds/Fungi
Associated with “sick”
building syndrome (SBS)
Hypersensitivity and
allergic reactions to spores
(mycelium)
Metabolites of moulds yield
mycotoxins
SLIDE 3 Ergosterol Ergosterol
“ A Biomarker that can be used to confirm the
presence of Fungal Biomass …spores or mycelium”
- M.W. = 396.665
- C28H44O
- Air and Light Sensitive
- Stored cool/dark and under Argon
SLIDE 4 Why GC/MS/MS or SIS? Why GC/MS/MS or SIS?
Selectivity and Sensitivity
GC Retention Time + Intensity + Unique mass fragments or
mass spectrum
Ergosterol is derivatized - Trimethyl Sily group (TMS) to
replace the free –OH group
- RX- OH + Pyridine + BSTFA RX- O-Si (CH3)3
Yields a derivative that has unique mass spectral
characteristics and good gas chromatography behaviour!
60oC 30 min
SLIDE 5
Ergosterol Mass Spectrum (E.I.) Ergosterol Mass Spectrum (E.I.)
SLIDE 6 Mass Spectrum Erg Mass Spectrum Erg-
TMS
SLIDE 7
Varian Saturn 2000 Ion Trap Varian Saturn 2000 Ion Trap – – GC/MS/MS GC/MS/MS
Erg-TMS m/z 363 Collision Induced Dissociation (CID) yields two distinctive “product ” ions at m/z 157 and 239
SLIDE 8
Gas Chromatography Parameters Gas Chromatography Parameters
Column: PTE-5, HP-5 or DB-5 0.25 mm. I.D. x 30 meters (250 microns film thickness) Temperature Program: 95 oC (1 min hold) to 310 oC @ 20 oC hold for 10.5 min Injection Port Temperature: 290 oC Splittless Injection Time: 0.50 min Interface Temperature: 290 oC
SLIDE 9
Full Scan, MS/MS and SIS Ion Trap Full Scan, MS/MS and SIS Ion Trap Parameters Parameters
SLIDE 10
Ion Trap Flexibility Ion Trap Flexibility – – Full Scan, MS/MS Full Scan, MS/MS and SIS data in one run and SIS data in one run
SLIDE 11 Extraction Procedure for Erg Extraction Procedure for Erg-
TMS (Saponification, Derivatization and LLE) (Saponification, Derivatization and LLE)
- A. Saponification – cell lysis for the release of ergosterol from the fungal
cells
- Weigh or transfer a known amount to an 8 mL test tube and spike with
Internal standard and Surrogate (7-Dehydrocholesterol and Stigmasterol)
- Add 10% KOH/Methanol to immerse sample and heat to 80oC for 90 min
- Cool and add 1.0 mL water – polarity adjustment
SLIDE 12 1
- B. Extraction – Liquid/Liquid extraction (LLE) step using pentane
- Add 2 mL of pentane (HPLC grade) and shake for 5 min (2X)
SLIDE 13
- Transfer the top organic phase (pentane) to a clean tube -
careful not to transfer over water as well – BSTFA forms a cyclic TMS derivative with it!
- Blow down to dryness with a gentle stream of nitrogen
SLIDE 14
GC/MS/MS, Full Scan or SIS
- Add 15 uL of Pyridine and 50 uL of BSTFA and incubate at 60 oC
for 30 min
- Top sample with known volume (0.5 mL) of Toluene and inject into
the GC/MS in either the Full Scan, MS/MS or SIS mode
SLIDE 15 Erg Erg-
TMS MS/MS Calibration
SLIDE 16 GC/MS/MS - LOD Determination (06/09/03)
GC/MS/MS Method: Erg_060903_MSMS.mth Instrument: Saturn 2000 Sample I.D. LOD Level Erg-TMS Peak Area Internal Std Peak Ratio Signal:Noise Factored LOD* (pg) (m/z 157) Peak Area (m/z 351) (m/z 363/351) (m/z 157 S/N RMS) (ng/Filter) LOD-MS-1 61 70407 0.00087 sn 61:1 LOD-MS-2 5.23 77 64981 0.00118 sn 13:1
0.17
LOD-MS-3 75 68451 0.00110 sn 0:1 Mean 0.00105 Std Dev 0.00016 CV 15.7 LOD-MS-4 379 69736 0.00543 sn 106:1
0.34
LOD-MS-5 10.50 220 65081 0.00338 sn 52:1 LOD-MS-6 224 68648 0.00326 sn 89:1 Mean 0.00403 Std Dev 0.00122 CV 30.3 LOD-MS-7 352 68728 0.00512 sn 103:1 LOD-MS-8 26.12 323 62629 0.00516 sn 79:1
0.85
LOD-MS-9 349 71017 0.00491 sn 106:1 Mean 0.00506 Std Dev 0.00013 CV 2.6 LOD-MS-10 693 76767 0.00903 sn 178:1
1.70
LOD-MS-11 52.30 715 62633 0.01142 sn 25:1 LOD-MS-12 563 66715 0.00844 sn 291:1 Mean 0.00963 Std Dev 0.00158 CV 16.4
SLIDE 17 Single Ion Selection (SIS) - LOD Determination by GC/MS/SIS (06/02/03)
GC/MS/MS Method: Erg_060203_SIS.mth Instrument: Saturn 2000 Sample I.D. LOD Level Erg-TMS Peak Area Internal Std Peak Ratio Signal:Noise Factored LOD* (pg) (m/z 363) Peak Area (m/z 351) (m/z 363/351) (m/z 363 S/N RMS) (ng/Filter) LOD-SIS-1 14134 12238937 0.00115 sn 30:1 LOD-SIS-2 15.70 18388 13041427 0.00141 sn 45:1
0.51
LOD-SIS-3 17942 13334016 0.00135 sn 53:1 Mean 0.00130 Std Dev 0.00013 CV 10.2 LOD-SIS-4 23190 11351336 0.00204 sn 37:1 LOD-SIS-5 31.40 25388 11618658 0.00219 sn 110:1
1.02
LOD-SIS-6 28728 13981462 0.00205 sn 44:1 Mean 0.00209 Std Dev 0.00008 CV 3.8 LOD-SIS-7 32801 13283649 0.00247 sn 82:1 LOD-SIS-8 47.10 30865 13524370 0.00228 sn 169:1
1.53
LOD-SIS-9 31870 13512178 0.00236 sn 148:1 Mean 0.00237 Std Dev 0.00009 CV 4.0 LOD-SIS-10 46071 13463664 0.00342 sn 178:1 LOD-SIS-11 78.50 41470 12560334 0.00330 sn 25:1
2.55
LOD-SIS-12 43922 13531485 0.00325 sn 291:1 Mean 0.00332 Std Dev 0.00009 CV 2.7
SLIDE 18
Method Detection Limit (MDL) Method Detection Limit (MDL)
SLIDE 19 Erg Erg-
- TMS Autosampler Trap Stability Check
TMS Autosampler Trap Stability Check
SLIDE 20
Characterization of House Dust Sample Characterization of House Dust Sample – – Full Scan Mode Full Scan Mode
SLIDE 21
Full Scan Data Full Scan Data – – Dust Sample Dust Sample
SLIDE 22 Ergosterol Ergosterol-
TMS by GC/MS/MS – – 250 ng 250 ng
SLIDE 23 GC/MS/MS House Dust Screening for GC/MS/MS House Dust Screening for Ergosterol Ergosterol-
TMS
SLIDE 24
Building Material Analysis by GC/MS and MS/MS Building Material Analysis by GC/MS and MS/MS Cellulose Insulation Checked for Ergosterol Cellulose Insulation Checked for Ergosterol
SLIDE 25 Work Place Site Work Place Site -
- Air Analysis for Ergosterol
Air Analysis for Ergosterol-
- TMS Detection by GC/MS/SIS
TMS Detection by GC/MS/SIS
SLIDE 26
Summary Summary
GC/MS/MS yields the selectivity and
sensitivity for detection of Ergosterol in materials that have a complex sample matrix (Building materials and Dust)
Sensitivity in the range of 25 -100 pg for
MS/MS and even lower in SIS mode with relatively clean matrix
SLIDE 27 Acknowledgments Acknowledgments
- School of Occupational and Environmental Hygiene (SOEH)
- Karen Bartlett, PhD
- Ray Li. M.Sc.
- Winnie Chu, PhD
- Funding by:
U.S. Borax, Genics, Michael Smith Foundation and
- Website: www.soehlab.ubc.ca
Welcome collaboration with others !!