EXPERIMEN TS, MO DELS, AN D ASSAYS PRESEN TED BY: CHRISTIAN FAY, - - PDF document

experimen ts mo dels an d assays
SMART_READER_LITE
LIVE PREVIEW

EXPERIMEN TS, MO DELS, AN D ASSAYS PRESEN TED BY: CHRISTIAN FAY, - - PDF document

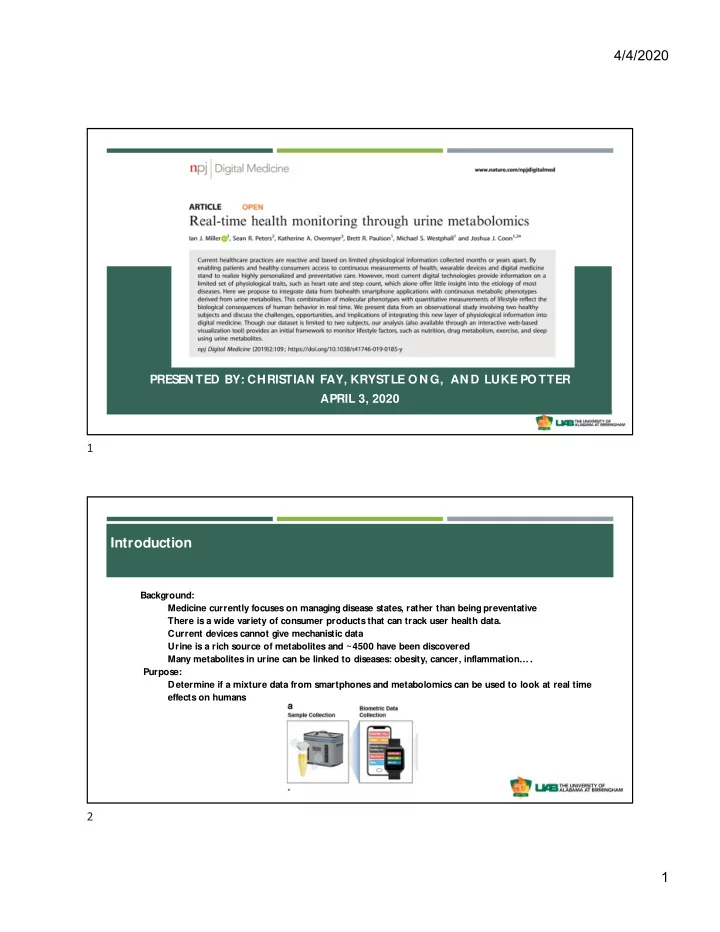
4/4/2020 EXPERIMEN TS, MO DELS, AN D ASSAYS PRESEN TED BY: CHRISTIAN FAY, KRYSTLE O N G, AN D LUKE PO TTER APRIL 3, 2020 1 Introduction Background: Medicine currently focuses on managing disease states, rather than being preventative There


slide-1
SLIDE 1

4/4/2020 1

EXPERIMEN TS, MO DELS, AN D ASSAYS

PRESEN TED BY: CHRISTIAN FAY, KRYSTLE O N G, AN D LUKE PO TTER APRIL 3, 2020

Introduction

Background: Medicine currently focuses on managing disease states, rather than being preventative There is a wide variety of consumer products that can track user health data. Current devices cannot give mechanistic data Urine is a rich source of metabolites and ~4500 have been discovered Many metabolites in urine can be linked to diseases: obesity, cancer, inflammation…. Purpose: Determine if a mixture data from smartphones and metabolomics can be used to look at real time effects on humans

1 2

slide-2
SLIDE 2

4/4/2020 2 Methods

Sample preparation Urine was collected midstream decanted in BD Vacutainer Urine Complete Cup Kit and immediately stored at -80 C or dry ice overnight and then stored at -80 C Samples were derivatized for gas chromatography analysis using a 50 L solution of 1:1 pyridine: N - Methyl-N -(trimethylsilyl)trifluoroacetamide with 1% trimethylchlorosilane and incubated at 60 C for 30 min Gas Chromatography Samples analyzed in Thermo Scientific Gas Chromatography-Fourier Transform Mass Spectrometry (GC-FTMS ) O rbitrap using a temperature gradient starting at 100°C (hold time of one minute), and increasing at a rate of 8.5°C per minute until reaching 260°C then increased to 50°C per minute until reaching a final temperature of 320°C Data was analyzed using Y3K GC Q uantitation Pipeline Ethyl glucuronide standard was used and processed in the same manner

Methods

Biometric data Recorded using Lose It! App Subject 1 calorie activity was monitored using an Apple W atch Series 2 Sleep was calculated using the Sleep Cycle App Statistical analysis: All samples were normalized to total ion current (TIC) Most of the statistical analysis was done on log2 transformed (TIC) data

3 4

slide-3
SLIDE 3

4/4/2020 3 Figure 1 Figure 1

5 6

slide-4
SLIDE 4

4/4/2020 4 Figure 2 Figures 3

7 8

slide-5
SLIDE 5

4/4/2020 5 Figures 3 Figures 4

9 10

slide-6
SLIDE 6

4/4/2020 6 Figures 4 Conclusions

General

  • Proof of principal for using nutritional and lifestyle tracking apps in concert with

urine metabolomics for better health predictions and medical personalization Critiques

  • Lack of sleep and exercise data for both subjects

11 12