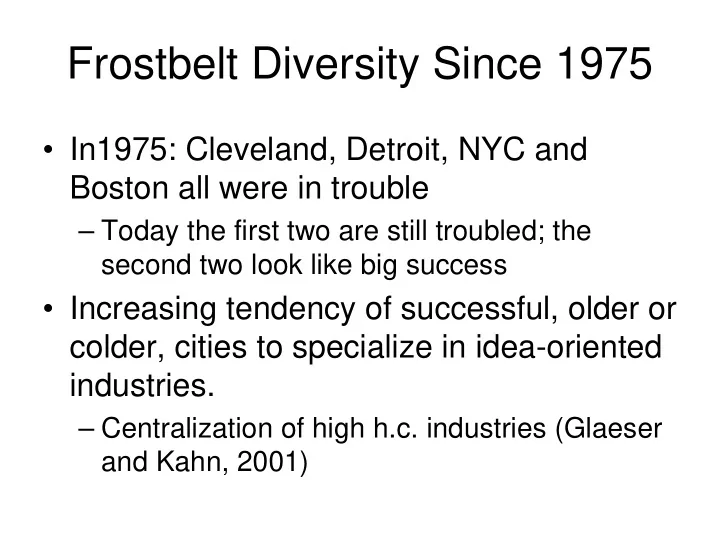
Frostbelt Diversity Since 1975
- In1975: Cleveland, Detroit, NYC and
Boston all were in trouble
– Today the first two are still troubled; the second two look like big success
- Increasing tendency of successful, older or
Frostbelt Diversity Since 1975 In1975: Cleveland, Detroit, NYC and - - PowerPoint PPT Presentation
Frostbelt Diversity Since 1975 In1975: Cleveland, Detroit, NYC and Boston all were in trouble Today the first two are still troubled; the second two look like big success Increasing tendency of successful, older or colder, cities
coef = .01169126, se = .00161765, t = 7.23 e( dpop | X) e( bagrad90 | X )
24.0572
.311965
Steubenv Johnstow Altoona, Lima, OH Mansfiel Youngsto Williams Lewiston Jackson, Joplin, Janesvil Wausau,
Kokomo, Sharon, Scranton Sheboyga Canton-- York, PA Jamestow Elkhart- Decatur, Evansvil Reading, Saginaw- Terre Ha Elmira, Glens Fa Rockford Utica--R Sioux Ci Fort Way Erie, PA Muncie, Lancaste Benton H Dubuque, Duluth-- Eau Clai Peoria--
Appleton Waterloo Allentow Davenpor Toledo, Green Ba Bangor, Grand Ra Harrisbu Detroit- Springfi Pittsbur Clevelan Buffalo- Dayton-- South Be Cincinna La Cross Binghamt Indianap Kalamazo Providen
Sioux Fa Milwauke Syracuse Springfi Pittsfie Rapid Ci Grand Fo Wichita, Cedar Ra New Lond Springfi Bismarck Philadel Topeka, Omaha, N Des Moin Rocheste Kansas C Columbus Chicago- Albany-- Lansing- Fargo--M New York Lafayett Hartford Minneapo Portland Lincoln, Boston-- Barnstab Blooming Burlingt New Have Rocheste State Co Blooming Champaig Madison, Columbia Lawrence Iowa Cit
1980 Share of Skilled Workers Change Income 1980-2000 Fitted values .02 .04 .06 .08 .1 .2 .4 .6
Akron, O Albany-S Albuquer Allentow Atlanta- Austin-R Bakersfi Baltimor Baton Ro Birmingh Boston-Q Buffalo- Canton-M Charlest Charlott Chicago- Cincinna Clevelan Columbia Columbus Dallas-P Dayton, Detroit- El Paso, Fort Lau Fort Way Fresno, Gary, IN Grand Ra Greensbo Harrisbu Hartford Honolulu Houston- Indianap Jackson, Jacksonv Kansas C Knoxvill Lancaste Las Vega Little R Los Ange Louisvil Memphis, Milwauke Minneapo Nashvill Nassau-S New Orle New York Newark-U Oklahoma Omaha-Co Orlando, Oxnard-T Philadel Phoenix- Pittsbur Portland Providen Richmond Riversid Rocheste Sacramen Salt Lak San Anto San Dieg San Fran San Jose Seattle- Spokane, Springfi
Stockton Syracuse Tacoma, Tampa-St Toledo, Tucson, Tulsa, O Washingt West Pal Wichita, Youngsto
.05 .1 Change in Percent with BA 1990-2000 .1 .2 .3 .4 .5 Percent of Adults with BA Degree in 1990
Figure 2 - Self Employment and Income by Education
Percent Self Employed Percent Self Employed Earning over $110,000 Annually
0% 5% 10% 15% 20% 25% 30% No High School Some High School High School Graduate Some College College Graduate or Higher Education Percent
Change in Patents 1990-2000 Change in Income 1990-2000 Fitted values
1 2
.1 .2 .3
Akron, O Albany-S Albuquer Allentow Atlanta- Austin-R Bakersfi Baltimor Baton Ro Birmingh Boston-Q Buffalo- Charlest Charlott Chicago- Cincinna Clevelan Colorado Columbia Columbus Dallas-P Dayton, Detroit- El Paso, Fort Lau Fort Wor Fresno, Gary, IN Grand Ra Greensbo Greenvil Harrisbu Hartford Honolulu Houston- Indianap Jacksonv Kansas C Knoxvill Lake Cou Las Vega Little R Los Ange Louisvil Madison, Memphis, Milwauke Minneapo Nashvill Nassau-S New Have New Orle New York Newark-U Oakland- Oklahoma Omaha-Co Orlando, Oxnard-T Philadel Phoenix- Pittsbur Portland Poughkee Providen Raleigh- Richmond Riversid Rocheste Sacramen Salt Lak San Anto San Dieg San Fran San Jose Sarasota Scranton Seattle- Springfi
Stockton Syracuse Tacoma, Tampa-St Toledo, Tucson, Tulsa, O Virginia Washingt West Pal Wichita, Wilmingt Youngsto
Self Employment Rate Log Avg Firm Size 1977 . .05 .1 2.2 2.4 2.6 2.8 3
Akron, O Albany-S Albuquer Allentow Atlanta, Atlanta, Atlanta, Austin, Bakersfi Baltimor Baton Ro Birmingh Boise Ci Boston, Buffalo- Canton, Charlest Charlott Chicago, Cincinna Clevelan Colorado Columbia Columbus Dallas-F Dayton-S Denver-B Detroit, El Paso, Fort Lau Fort Way Fresno, Grand Ra Greensbo Harrisbu Hartford Honolulu Houston- Indianap Jackson, Jackson, Jackson, Jacksonv Kansas C Knoxvill Lakeland Lancaste Las Vega Little R Los Ange Louisvil McAllen- Melbourn Melbourn Melbourn Memphis, Miami-Hi Milwauke Minneapo Modesto, Monmouth Nashvill Nashvill Nashvill New York Norfolk- Norfolk- Norfolk- Oklahoma Omaha, N Orlando, Orlando, Orlando, Pensacol Philadel Phoenix, Pittsbur Portland Portland Portland Providen Providen Providen Raleigh- Richmond Riversid Rocheste Sacramen Salt Lak San Anto San Dieg San Fran San Jose Sarasota Scranton Seattle- Spokane, Springfi
Stockton Syracuse Tacoma, Tampa-St Toledo, Tucson, Tulsa, O Tulsa, O Tulsa, O Ventura- Washingt West Pal West Pal West Pal Wichita, Youngsto Youngsto Youngsto
Figure 5
Employment Growth and Average Firm Size
Average Firm Size - 1977 Employment Growth 1977-2000 Fitted values 2.2 2.4 2.6 2.8 3 .5 1 1.5
Akron, O Albany-S Albuquer Allentow Atlanta, Austin, Bakersfi Baltimor Baton Ro Birmingh Boise Ci Boston, Buffalo- Canton, Charlest Charlott Chicago, Cincinna Clevelan Colorado Columbia Columbus Dallas-F Dayton-S Denver-B Detroit, El Paso, Fort Lau Fort Way Fresno, Grand Ra Greensbo Harrisbu Hartford Honolulu Houston- Indianap Jackson, Jacksonv Kansas C Knoxvill Lakeland Lancaste Las Vega Little R Los Ange Louisvil McAllen- Melbourn Memphis, Miami-Hi Milwauke Minneapo Modesto, Monmouth Nashvill New Orle New York Norfolk- Oklahoma Omaha, N Orlando, Pensacol Philadel Phoenix, Pittsbur Portland Providen Raleigh- Richmond Riversid Rocheste Sacramen Salt Lak San Anto San Dieg San Fran San Jose Sarasota Scranton Seattle- Spokane, Springfi
Stockton Syracuse Tacoma, Tampa-St Toledo, Tucson, Tulsa, O Ventura- Washingt West Pal Wichita, Youngsto
R ate of Se lf Em ployment 19 70 L
970-2000 Fitted values .2 .4 .6
1 2
Akron, O Albany-S Albuqu er Allentow Atlanta, Au stin, Bakersfi Baltimor Baton Ro Birmingh Boston, Buffalo- Canton, Charlest Charlott Chicago, Cincinn a Clevelan Columbia Colu mbu s Dallas-F Dayton-S Denver-B Detroit, El P aso, Fort Lau Fort Way Fresno, Grand Ra Greensbo Harrisbu Hartford Honolulu Houston- Indianap Jackson , Jacksonv Kan sas C K noxvill Lancaste Las Vega Little R Los Ange Louisvil Memphis, Miami-Hi Milwauke Minneapo Nashvill New Orle New York Norfolk- Oklahoma Omaha, N Orlando, P hiladel Phoenix, Portland Providen Richmond Riversid Rocheste Sacramen Salt Lak San Anto S an Dieg San Fran San Jose Scranton Seattle- Spokane, Springfi
Stockton Syracu se Tacoma, Tampa-St Toledo, Tucson, Tulsa, O Ventura- Washingt West Pal Wich ita, Y
gsto