From Tahoma to Tacoma: Using basin-scale planning to From Tahoma to - - PowerPoint PPT Presentation
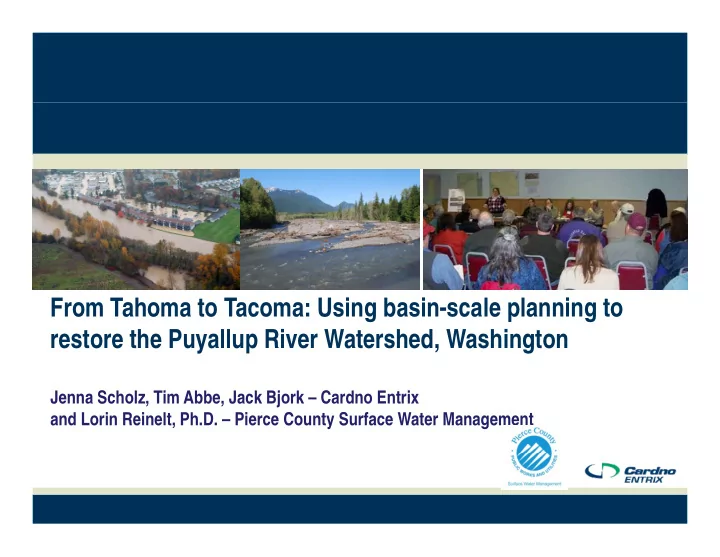
From Tahoma to Tacoma: Using basin-scale planning to From Tahoma to Tacoma: Using basin scale planning to restore the Puyallup River Watershed, Washington Jenna Scholz, Tim Abbe, Jack Bjork Cardno Entrix and Lorin Reinelt, Ph.D. Pierce
Overview of Presentation
- Pierce County Rivers Flood Hazard Management Planning
- Major Studies
- Economic Analysis
- USGS Joint Agreement Studies
- Flood Plan Recommendations
- Policy, Programs, Capital Projects
- Rapid Geomorphic Assessment
- Height above water surface (HAWS)
I f t l d i
- Inform conceptual designs
2
Pierce County Rivers Flood Hazard Management Plan
- Mt. Rainier to Puget Sound
(Commencement Bay, Nisqually D lt ) Delta) Transition from Forest, Rural/Agriculture to Urban Rural/Agriculture to Urban
Rivers Flood Hazard Management Plan - Geographic Scope
Pierce County Rivers Four Major Rivers: Four Major Rivers:
1. Puyallup River 2. White River 3. Carbon River 4. Nisqually River
Three Large Tributaries (> 5 000 f k fl ) (> 5,000 cfs peak flow):
5. Greenwater River 6. South Prairie Creek 7. Mashel River 7. Mashel River
4
River Management Plan - Land Use and Landscapes
H h d l d i th
- Humans have developed in the
floodplain and attempted to manage rivers and flooding since late 1800s since late 1800s.
- Port, industrial, commercial and
residential development residential development
5
Watershed, Development and Landscape Change Landscape Change
Historical Changes:
- Great flood of 1906
- 1916 –Permanent diversion of
White River to Puyallup River
- Development of Port, Tacoma
and lower valley - began in y g early 1900s
- Levees/revetments in Middle
Puyallup valley (1930s – 60s) y p y ( )
- Puyallup and Lower White
development (1960s –present)
6
Flood History in the Puyallup River Basin
- 26 significant flood events
26 significant flood events in last 100 years
- 1933 – 57,000 cfs
- 1948 – MMD construction
- 14 federally declared
disasters since 1962 disasters since 1962
- Q100 = 48,000 cfs
- 1996 – 46,700 cfs
- 2009 – 47,700 cfs
Mud Mountain Dam (1948) 7
Pierce County Flood Hazard Management Plan Goals:
R d i k t lif d t
- Reduce risks to life and property
- Identify and implement flood hazard management activities in a cost-
effective and sustainable manner effective and sustainable manner
- Support compatible human uses, economic activities, and improve
habitat conditions
- Develop a long-term and flexible funding strategy
8 Puyallup River Flooding, January 2009 South Prairie Creek Flooding, November 2004
Policies:
River Management – Desired Outcomes
- Dictate how projects and programs are developed
- Guide current and future decisions about river and floodplain management
- Address projects, floodplain development regulations, flood warning and
emergency response funding and other general issues emergency response, funding, and other general issues Programs:
- Implementation of flood hazard management actions:
- facility maintenance and repair, flood warning and emergency response,
education/outreach, technical assistance, floodplain and channel migration mapping, river channel management. pp g, g
- Enhancement or improvement of existing as well as new programs:
- Adaptive management, climate change, advance habitat mitigation, public
access water quality incidental take authorization access, water quality, incidental take authorization Projects:
- Typically address a specific problem at a particular location
yp y p p p
- Implementation guided largely by priority and funding availability
Facilitation to Reach Plan Objectives
- Consensus model
- 18 monthly meetings
- 27 diverse members
- 11 Public Meetings
W k h f El t d Offi i l
Nisqually Tribe Port of Tacoma MBA of Pierce County
Flood Plan Advisory Committee
- Workshop for Elected Officials
- Pierce County Participation:
Surface Water Management, Transportation, Planning and Land Services, Emergency
City of Fife City of Sumner City of Tacoma y Puyallup Tribe of Indians Watershed Councils (Puyallup & Ni ll ) y Agricultural Community Tacoma-Pierce County Assoc.
- f Realtors
Management, Parks & Recreation, Economic Development, Government Relations, Agricultural Programs
City of Tacoma City of Orting City of Puyallup City of Pacific Town of South Prairie NOAA Fisheries Citizen Representatives -- Floodplain residents, Nisqually) Citizens for a Healthy Bay Tahoma Audubon Society
- Mt. Rainier National Park
Washington Dept. of Fish & Wildlife Washington Dept. of Ecology property owners Pierce Conservation District Drainage District #10 Drainage District #10
Summary of Economic Analysis Findings
- Threats to human health
and safety and safety
- Economic Impacts
- Transportation Impacts
Transportation Impacts
- Recreational Impacts
Economics Analysis Report
Economic Impacts and Flood Losses
Pierce County faces potential flood related losses in excess
- f $725 million
- Health and Safety (in Floodplain)
– Population 21,193 – Jobs (in floodplain and with ripple effect) 11,868/17,596 Homes 9 340 – Homes 9,340 – People served by 3 wastewater treatment plants 216,000 – Raw sewage discharged to floodwater and rivers 1 eek to 4 months to restore primar /secondar treatment – 1 week to 4 months to restore primary/secondary treatment
12
Economics Analysis Report
Water and Sediment Loading into Puget Sound
Magril, USGS 2011 Puyallup River MAF is 1/5 of Skagit River Annual sediment load – Three largest have Cascade volcanoes
USGS Study of Carrying Capacity and Sedimentation Trends
(USGS 2010) (USGS 2010)
Map of the Change in Map of the Change in Bed Elevation in the Puyallup White and Puyallup, White, and Carbon Rivers (1984 2009) (1984-2009)
USGS Study of Carrying Capacity and Sedimentation Trends
Orting – Calistoga Orting Calistoga reach options to reduce flooding: flooding: S tb k l
- Setback levee
- Gravel bar scalping
USGS Study of Carrying Capacity and Sedimentation Trends
Initial
0.5 1 ine (feet)
FLOW
Initial Change in 100‐yr
‐1 ‐0.5 evation from basel
100 yr Water‐ Surface
‐2 ‐1.5 yr water surface ele DS extent US extent Gravel Bar Scalping Setback Levee
Surface Elevation
‐3 5 ‐3 ‐2.5 ange in FEMA 100‐y Combined ‐4 3.5 18.0 19.0 20.0 21.0 22.0 23.0 24.0 Cha River Mile
Sediment Yield Nisqually River: 1945-2010 q y
Nisqually River: 1 070 m3/km2/yr 1,070 m3/km2/yr
> 1 > 13 times times
Little Nisqually River: 80 m3/km2/yr (to scale) ( )
Preliminary results subject to change
Sediment Load: White River at R St. near Auburn, WA
Estimat Estimated Annual d Annual Sediment Load (Ma Sediment Load (May 20 2010 – – Mar arch 20 ch 2011): 11): 540 000 00
3 /
/
Bedload 49,000 m3/yr 9%
~54 540,000 000 m3 / / yr yr
Suspended Suspended p Sand 290,000 m3/yr 54% Silt/Clay 200,000 m3/yr 37%
Preliminary results subject to change
- Mt. Rainer Rivers – Sediment Deposition Areas
Preliminary results subject to change
Problem Identification (250 problems)
- Flooding of Infrastructure (48)
- Levee Overtopping/Breaching (45)
- Facility Maintenance/Repair (37)
- Fish Habitat Problem Areas (30)
- Channel Migration (22)
G l A l ti di t
- Gravel Accumulation-sediment
deposition(19)
- Tributary Backwater Flooding (17)
- Public Access (13)
- Public Safety (12)
- Development/increase flooding risk (7)
35 Programmatic recommendations including:
Programmatic Recommendations
35 Programmatic recommendations including:
- Information/Mapping/Technical Assistance
- Education and Flood Preparedness, Flood Warning and Emergency Response
p , g g y p
- Fish Habitat and Riparian Area Mitigation
- Land Use/Regulatory/Acquisition/Structure Elevation
- River Channel Management (levees, revetments, flood gates, engineered log
jams, pump stations)
- Facility Repair/Maintenance
- Habitat Conservation Planning
Climate Change
- Climate Change
- Water Quality Impacts of Flooding
- Public Access
Carbon River Levee Repair
Capital Improvement Project Recommendations 36 recommendations including: Ch l i ti i t (ELJ )
- Channel migration resistance (ELJs)
- Setback levee
- Flood walls
Flood walls
- Acquisitions
Setback Levee on the Puyallup River
Management Strategies/Level of Protection
Levee Reaches
- 200-year design + 3 feet of freeboard
- 100-year design + 3 feet of freeboard
y g
- Maintain existing level of protection (based on USGS 2009 carrying capacity)
- Maintain existing levee prism
Revetment Reaches
- Channel migration resistance design
- Channel migration prevention design
Non-structural approaches
- Floodplain acquisition/home buyouts
- Floodplain development regulations
Bio Revetment on White River in King County Bio-Revetment on White River in King County
Flood Hazard Management Plan Accomplishments 2009-2011
- Developed goals, objectives, guiding principals
- Identified and prioritized among >250 problems
- Developed solutions for priority problems
- Devised strategies/levels of protection for 7 rivers
- Agreed on 30 river management policies
Agreed on 30 river management policies
- Agreed on 35 Programmatic Recommendations
- Agreed on 34 Capital Project Recommendations
C l t d E i A l i f fl d i t
- Completed an Economic Analysis of flood impacts
- Collaborated with USGS on Joint Agreement
- Analyzed adverse environmental impacts (SEPA)
- Completed draft plan – October 2011
- Release of draft plan and EIS to public – Feb. 2012
1933 Flood: 57,000 cfs
Early Action Projects - Assessment and Implementation
- Priority locations for river/flood management actions
- Integrated with planning-level policies and recommendations
- Previously identified with funds allocated
Channel Migration on the Nisqually River – N b 2006 Upper Puyallup – Neadham Road Levee Failure November 2008 Levee Failures November 2006
River Assessment & Concept Solutions
Rapid Geomorphic Assessment:
- channel migration problem areas,
- levee/revetment breaching problem areas,
sediment/gra el acc m lation
- sediment/gravel accumulation,
- habitat problem areas (e.g., facility maintenance activities affecting
spawning/rearing habitat),
- climate change issues (e g glacial retreat & greater precipitation impacts
- climate change issues (e.g., glacial retreat & greater precipitation impacts
- n sediment transport)
- Concept-level solutions
Application Projects:
- Upper Puyallup Orville Road Channel
Migration Protection C b Ri L B k
- Carbon River Levee Bank
Stabilization/ Flow Deflection
- Nisqually Park Levee Protection
River Mgmt Tools– Height Above Water Surface Mapping
Nisqually River Engineered Log Jams
ELJs Outside Levee Prism
- Approved by ACOE in concept
- Deflect flows and promote sediment deposition
- Designed to work in conjunction with stabilization
methods implemented by Mt. Rainier National Park
Upper Puyallup – Orville Road
Problem:
- Orville Road lifeline arterial
- Channel migration on left bank threatens Rd
- Levee damaged in numerous locations
- Threatens 2.5 miles of Rd and private property
Upper Puyallup / Orville Road
Environmental Permits likely required:
- Shoreline and Critical Areas Approval Pierce County
Shoreline and Critical Areas Approval, Pierce County
- Section 404 - US Army Corps of Engineers
- Section 401 - WA Dept. Of Ecology
- HPA - Dept. of Fish and Wildlife
Coordination:
- US Fish and Wildlife Service, NOAA, US Army Corps of Engineers, WA Dept. of Fish
and Wildlife, WA Dept. of Ecology, Puyallup and Muckleshoot Tribes of Indians and Wildlife, WA Dept. of Ecology, Puyallup and Muckleshoot Tribes of Indians Threatened Fish Use:
- Puget Sound Chinook, steelhead, and bull trout
Upper Puyallup / Orville Road
Proposed Solution:
Increase flood plain connectivity & improve salmonid habitat (~$17M):
- 8 500’ of setback revetment
8,500 of setback revetment
- 3000’ of setback Levee
- 30 Engineered Log Jams (ELJs)
- Dolotimber system
Alternative long-term solution (~$38M):
- Relocate 2.7 miles of Orville Rd