
SLIDE 1
Monitoring nearshore, delta, and freshwater habitats in Puget Sound
Tim Beechie, Mike Ford, Kurt Fresh, Jason Hall, Martin Liermann, George Pess*, Phil Roni, Mindy Rowse, Alex Stefankiv, & Britta Timpane-Padgham
*Speaking on behalf of project
NOAA Fisheries, Northwest Fisheries Science Center, Seattle, WA
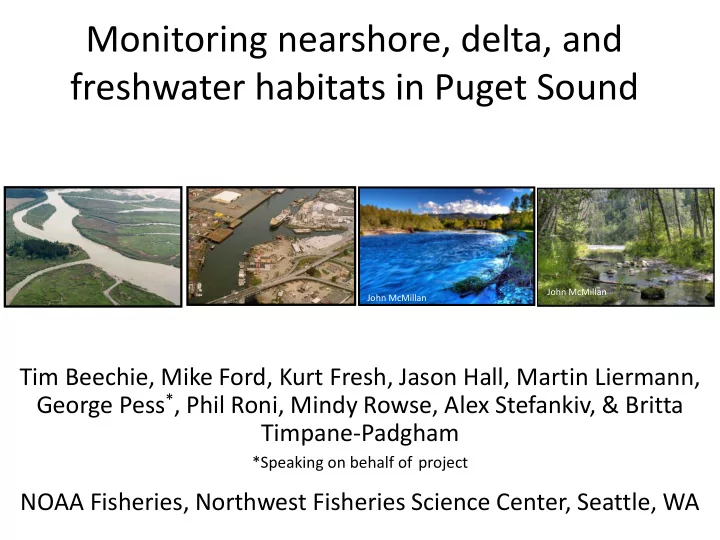
John McMillan John McMillan