frequency analysis of magnetic journal bearing
play

Frequency Analysis of Magnetic Journal Bearing Instability for MMR - PDF document

Transactions of the Korean Nuclear Society Virtual Spring Meeting July 9-10, 2020 Frequency Analysis of Magnetic Journal Bearing Instability for MMR Condition Dokyu Kim a , SeungJoon Baik b , Jeong Ik Lee a* a Department of Nuclear and Quantum


  1. Transactions of the Korean Nuclear Society Virtual Spring Meeting July 9-10, 2020 Frequency Analysis of Magnetic Journal Bearing Instability for MMR Condition Dokyu Kim a , SeungJoon Baik b , Jeong Ik Lee a* a Department of Nuclear and Quantum Engineering, KAIST, Daejeon, South Korea b Korea Atomic Energy Research Institute, Daejeon, South Korea Corresponding author : jeongiklee@kaist.ac.kr 1. Introduction The attention on the distributed power generation with nuclear energy is increasing due to the electricity grid decentralization and demand for mobile power generation without emission of CO 2 . A concept of fully modularized fast reactor with a supercritical CO 2 (S-CO 2 ) cooled direct Brayton cycle, namely Micro Modular Reactor (MMR), for 10MWe power output is developed for the distributed power generation based on the nuclear 
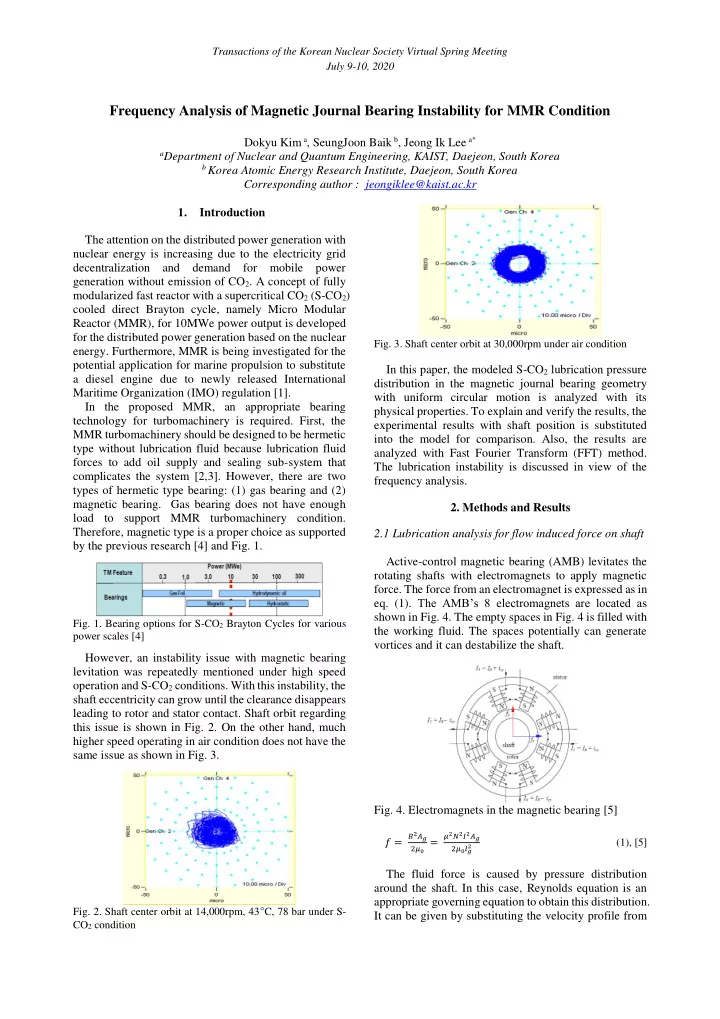
Fig. 3. Shaft center orbit at 30,000rpm under air condition energy. Furthermore, MMR is being investigated for the potential application for marine propulsion to substitute In this paper, the modeled S-CO 2 lubrication pressure a diesel engine due to newly released International distribution in the magnetic journal bearing geometry Maritime Organization (IMO) regulation [1]. with uniform circular motion is analyzed with its In the proposed MMR, an appropriate bearing physical properties. To explain and verify the results, the technology for turbomachinery is required. First, the experimental results with shaft position is substituted MMR turbomachinery should be designed to be hermetic into the model for comparison. Also, the results are type without lubrication fluid because lubrication fluid analyzed with Fast Fourier Transform (FFT) method. forces to add oil supply and sealing sub-system that The lubrication instability is discussed in view of the complicates the system [2,3]. However, there are two frequency analysis. types of hermetic type bearing: (1) gas bearing and (2) magnetic bearing. Gas bearing does not have enough 2. Methods and Results load to support MMR turbomachinery condition. Therefore, magnetic type is a proper choice as supported 2.1 Lubrication analysis for flow induced force on shaft by the previous research [4] and Fig. 1. Active-control magnetic bearing (AMB) levitates the rotating shafts with electromagnets to apply magnetic force. The force from an electromagnet is expressed as in eq. (1). The AMB’s 8 electromagnets are located as shown in Fig. 4. The empty spaces in Fig. 4 is filled with Fig. 1. Bearing options for S-CO 2 Brayton Cycles for various the working fluid. The spaces potentially can generate power scales [4] vortices and it can destabilize the shaft. However, an instability issue with magnetic bearing levitation was repeatedly mentioned under high speed operation and S-CO 2 conditions. With this instability, the shaft eccentricity can grow until the clearance disappears leading to rotor and stator contact. Shaft orbit regarding this issue is shown in Fig. 2. On the other hand, much higher speed operating in air condition does not have the same issue as shown in Fig. 3. Fig. 4. Electromagnets in the magnetic bearing [5] 𝐶 2 𝐵 𝑕 𝜈 2 𝑂 2 𝐽 2 𝐵 𝑕 𝑔 = 2𝜈 0 = 2 (1), [5] 2𝜈 0 𝑚 𝑕 The fluid force is caused by pressure distribution around the shaft. In this case, Reynolds equation is an appropriate governing equation to obtain this distribution. Fig. 2. Shaft center orbit at 14,000rpm, 43 ° C, 78 bar under S- It can be given by substituting the velocity profile from CO 2 condition

  2. Transactions of the Korean Nuclear Society Virtual Spring Meeting July 9-10, 2020 Navier-Stokes equation to the continuity equation for Table II. Operation condition range of the model 10 ~ 50 ° C thin film [6]. The geometry for this equation is described Supply temperature in Fig. 5. In this research, the axial direction is assumed Supply pressure 50 ~ 100bar to be negligible because the axial velocity is relatively Rotational speed 30000 RPM Eccentricity ratio, ε = e/(R 2 − R 1 ) 0.07 smaller than the 𝑣 . Therefore, the governing equation can be simplified as in equation (2) with turbulence model Based on equation (2), the results show that the which is described in Table I [7]. Before solving this instability phenomena are based on the density change or equation, the transient term in right hand side (RHS) is high density itself. Therefore, the analysis for air handled by assuming the uniform circular motion. This condition with high density & pressure and atmospheric is numerically solved by finite difference method (FDM) condition were also evaluated for comparison. For the as shown in Fig. 5. evaluation, the RHS of the equation is separated as in (3). 𝜍ℎ 3 𝜖 𝜖𝑞 1 𝜖(𝜍ℎ𝑣) 𝜖(𝜍ℎ) 𝜖𝑌 ( 𝜖𝑌 ) = + 𝜍ℎ 3 𝜖𝑢 (2) 𝜖 𝜖𝑞 ℎ𝑣 𝜖𝜍 𝑣 𝜖h 𝜖(𝜍ℎ) 𝜖𝑌 ( 𝜖𝑌 ) = ( 2 ) 𝜖𝑌 + ( 𝜖𝑌 ) 𝜍 + 𝜖𝑢 (3) 𝑙 𝑦 𝜈 2 𝜖𝑌 𝑙 𝑦 𝜈 2 ( 𝑢 : time, 𝑣 : circumferential velocity, 𝜍 : density, 𝜈 : viscosity .) ( 𝑙 𝑦 = 12 + 𝐿 𝑦 𝑆𝑓 𝑜 𝑦 , 𝑆𝑓 : Reynolds number) The first term of the RHS around the shaft is plotted in Fig. 8 and the second term is shown in Fig. 9. From these Table I. Coefficient in Ng-Pan model figures, it is concluded that the significant difference Reynolds number, Re 𝐿 𝑦 𝑜 𝑦 between the high density air and the S-CO 2 condition is 50,000 < Re 0.0388 0.8 caused by the first term of RHS in eq. (3). Total values 5000 < Re <50000 0.0250 0.84 of the RHS around the shaft is plotted in Fig. 10. The Re < 5000 0.0039 1.06 specific pressure distribution is shown in Fig. 11. The forces calculated from this distribution is organized as Table III. From Table III, it is concluded that the density changes induce 𝐺 𝑦 to become larger. This also explains the tendencies from Fig. 8 Fig. 5. Coordinate description of Reynolds equation with geometry of the unbalanced shaft and the stator This analysis range is summarized in Table II. The modeling results are shown with the fluid force for various thermal properties as Fig. 6 and 7. 𝒊𝒗 𝝐𝝇 Fig. 8. ( 𝟑 ) 𝝐𝒀 around the shaft, 𝛇 = 0.25 and 30,000 RPM Fig. 6. 𝑮 𝒚 contour, 30000RPM, 𝜁 =0.07 ( 𝜁 : eccentricity ratio) 𝒗 𝝐𝒊 Fig. 9. ( 𝝐𝒀 ) 𝝇 around the shaft, 𝛇 = 0.25 and 30,000 RPM 𝟑 Fig. 7. 𝑮 𝒛 contour, 30000RPM, 𝜁 =0.07 . RHS total around the shaft, 𝛇 = 0.25 and 30,000 RPM Fig. 10

  3. Transactions of the Korean Nuclear Society Virtual Spring Meeting July 9-10, 2020 As substituting this position data into the lubrication model, the lubrication force, 𝐺 𝑀𝑉𝐶 is obtained. This is fitted with the eccentricity ratio in Fig.14. Fig. 11. Pressure distribution around the shaft, 𝛇 = 0.25 and 30,000 RPM Table III. Force on the shaft, 𝛇 = 0.25 and 30,000 RPM 𝐺 𝐺 Thermal condition 𝑦 (N) 𝑨 (N) Fig. 14. 𝐺 𝑀𝑉𝐶 with 30,000 RPM ( 𝐿 𝑦 𝑆𝑓 𝑜 𝑦 : Turbulence intensity) Air at 0.1 MPa, 35 ℃ 0.021 -1.852 Air at 8 MPa, -143 ℃ 0.854 -256.4 From this relationship, the stiffness is 6.47 N/ μm but CO 2 at 8 MPa, 35 ℃ 100.8 -124.5 it seems that 𝐺 𝑀𝑉𝐶 has weak relationship with eccentricity ratio. To explain this, the transient motion 2.2 Experimental analysis of magnetic bearing instability and the density change are expected to be the reason. The During the experiment, the CO 2 ’s thermal state is method to quantify the transient effect is planned for additional fitting. controlled by S-CO 2 pressurizing experiment (S-CO 2 PE) To analyze the effect of 𝐺 facility. The AMB test rig is attached to this facility as 𝑀𝑉𝐶 with non-uniform shown in Fig. 12. The AMB test rig consists of the stiffness and damping coefficient, the operation with compressor and the AMB. The impeller is removed so vacuum condition and S-CO 2 condition is compared after only the bearing effect is expected to be dominant. Fast Fourier Transform (FFT) was applied. The results of FFT with 5 operation speeds are plotted as waterfall plot in Fig. 15 for S-CO 2 condition. Fig. 15. FFT of the shaft trajectory data from S-CO 2 test The low frequency range is main region of the lubrication instability effect. There is significant noise Fig. 12. The AMB & compressor system for S-CO 2 but no clear peak for lubrication whirl or whip. It seems that the operation speed is not high enough in comparison The tests are proceeded for different RPM under 9 MPa & 50 ℃ (350kg/m 3 ) conditions. The shaft trajectory with critical speed. To analyze the lubrication instability effect, the test is shown in Fig. 13.I It is observed that the shaft motion with higher speed near critical speed is planned. In does not keep single revolving center when the RPM addition, comparison with FFT of vacuum condition will increases. be proceeding. 3. Conclusions From the developed lubrication model, it is concluded that the instability of the magnetic bearing control can be caused by S-CO 2 ’s physical properties. Based on this results, a magnetic bearing experimental facility is constructed. Tests for various RPMs were performed for verifying the model and the instability sources. The comparison between the model and the tests shows that the transient change of the shaft motion and the fluid Fig. 13. Shaft trajectory data from S-CO 2 test and 30,000 RPM physical properties could cause the instability. Also, the

Download Presentation
Download Policy: The content available on the website is offered to you 'AS IS' for your personal information and use only. It cannot be commercialized, licensed, or distributed on other websites without prior consent from the author. To download a presentation, simply click this link. If you encounter any difficulties during the download process, it's possible that the publisher has removed the file from their server.

Recommend


More recommend