
SLIDE 1
ICTCT Workshop Alcohol and drugs
Effects on traffic safety, not least for pedestrians
Stellenbosch, South Africa, on 4th, 5th April 2013
Presented by Randall Cable Pr Eng SANRAL
Dealing with Pedestrian Activity on Cape Town’s Freeways
- Introduction
- Cape Town Freeway Management System (CT FMS)
- 1. Overview
- 2. Incident data collection - Results
- 3. Pedestrian activity study - Results
- 4. CCTV Footage usage
- Way forward
- Questions ???
Presentation Overview
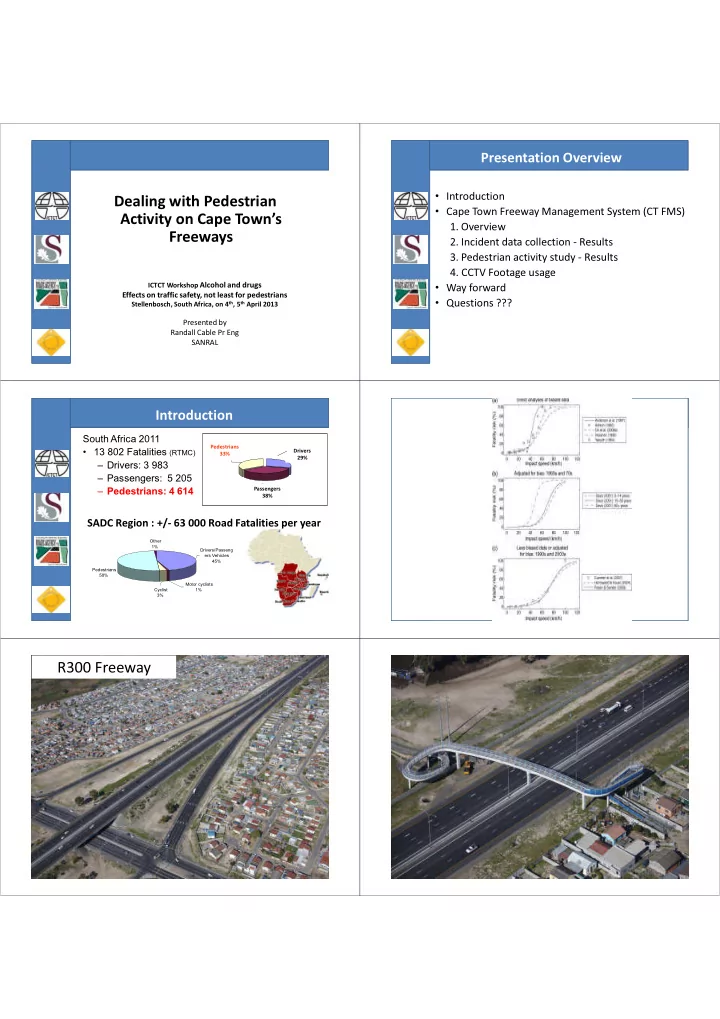
South Africa 2011
- 13 802 Fatalities (RTMC)
– Drivers: 3 983 – Passengers: 5 205 – Pedestrians: 4 614
Drivers, 4066, 30% Passengers, 5023, 36% Pedestrians 4678, 34%
Pedestrians 33% Drivers 29% Passengers 38%
Pedestrians 50% Other 1% Drivers/Passeng ers Vehicles 45% Cyclist 3% Motor cyclists 1%