
SLIDE 1
Forging Neighborhoods for All Generations
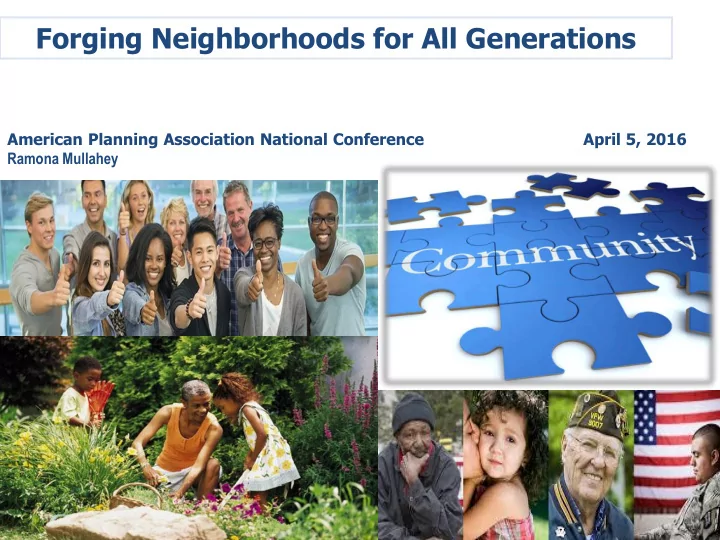
American Planning Association National Conference April 5, 2016 Ramona Mullahey
Forging Neighborhoods for All Generations American Planning - - PowerPoint PPT Presentation
Forging Neighborhoods for All Generations American Planning Association National Conference April 5, 2016 Ramona Mullahey United States AN AGING POPULATION Click on a state to view related charts and data. Source: Census 2000 analyzed by the
Forging Neighborhoods for All Generations
American Planning Association National Conference April 5, 2016 Ramona Mullahey
United States
AN AGING POPULATION
Click on a state to view related charts and data.Source: Census 2000 analyzed by the Social Science Data Analysis Network (SSDAN)
Source: U.S. Census Bureau, Population Division. 2012. “Table 12. Projections
(NP2012-T12).”
For the fourth year of The United States of Aging Survey, the National Association of Area Agencies on Aging (n4a), the National Council
achieve an even deeper understanding of how
addressing aging issues. These partners surveyed 1,650 U.S. adults 60 and older, and professionals who work closely with older Americans, including staff from Area Agencies
primary care physicians and pharmacists. The survey examines older adults’ attitudes on a range of issues such as health, finances and community support. The responses also reveal insights on how U.S. older adults are preparing for their later years, and what communities can do to better support an increasing, longer- living aging population.
Using smart growth and universal design to link the needs of children and the aging population – Mildred Warner
Emerging Issues
APA Division initiatives bring focus to planning challenges in local communities and neighborhoods throughout the nation:
Aging and Livable Communities
Aging in Community Policy Guide
Community Engagement Housing Transportation Land Use Economic Well-being Community Assets and Supports
Creating An Age-Advantaged Community: A Toolkit for Building Intergenerational Communities that Recognize, Engage and Support All Ages (2015) – Generations United and Metlife Foundation
The Age-friendly City
Better Housing Greater mobility More access to good food More interaction with neighbors Making life easier and richer – universal payoff
NEXT XT Pres esent enter ers
Regional Planning - W. Sibley Hall, Cornell University, New York City
Editor/Project Manager AARP Livable Communities
Director of Department of Planning & Permitting City & County of Honolulu
January 1961: At the first-ever White House Conference on Aging, AARP founder Dr. Ethel Percy Andrus shows President Dwight D. Eisenhower a model of the “Freedom House,” a home designed and built by AARP using “universal design” features so older adults can “age-in-place.”
Forging Neighborhoods for All Generations
Session - 569 The AARP Network of Age-Friendly Communities Presented by Melissa Stanton
Editor, AARP.org/Livable Advisor, AARP Livable Communities Programs Community, State and National Affairs Washington, D.C.
APA 2016 National Planning Conference
Phoenix, Arizona | April 5, 2016
THE UNITED STATES ENTERS WORLD WAR II IN DECEMBER 1941
The war in Europe ends in May 1945 | The war in Japan ends in August 1945
AARP Livable Communities presentation | American Planning Association 2016 National Planning Conference, Phoenix, AZ | April 5, 2016 And then the Baby Boomers arrive! 76 million American children are born between 1945 and 1964.
AARP Livable Communities presentation | American Planning Association 2016 National Planning Conference, Phoenix, AZ | April 5, 2016 Image: iStock.com Those babies now range in age from 51 to 70 years old.
By 2030, one out of five adults in the U.S. will be 65 or older.
AARP Livable Communities presentation | American Planning Association 2016 National Planning Conference, Phoenix, AZ | April 5, 2016 Photos from iStock.com But unlike prior generations of “older adults,” most of today’s “older adults” …
Do Not Want to Live in Retirement Communities
< In 1975, soon after moving with her husband from the New York City suburbs to a 55+ community in South Florida, “Bubbi Sheila” took her new bicycle for a ride.
AARP Livable Communities presentation | American Planning Association 2016 National Planning Conference, Phoenix, AZ | April 5, 2016 Photo courtesy Melissa Stanton Survey after survey finds that today’s older adults want to remain in their homes. But most houses haven’t been designed to adapt. In fact, American homes have traditionally been designed and built for able-bodied 35 year olds.
statement: “What I’d really like to do is stay in my current residence for as long as possible.”
Source: AARP Home and Community Preferences of the 45+ Population, 2014 AARP Livable Communities presentation | American Planning Association 2016 National Planning Conference, Phoenix, AZ | April 5, 2016 Photo from ThinkStock.com Survey after survey finds that today’s older adults want to stay in their community
But for the past 50 years, communities have developed around motor vehicles as the principal form of transportation. Adults who don’t or no longer drive are often out of luck.
statement: “What I’d really like to do is stay in my current community for as long as possible.”
Source: AARP Home and Community Preferences of the 45+ Population, 2014 AARP Livable Communities presentation | American Planning Association 2016 National Planning Conference, Phoenix, AZ | April 5, 2016 Photo from ThinkStock.com Source: AARP Housing Survey 2011
Source:
AARP Livable Communities presentation | American Planning Association 2016 National Planning Conference, Phoenix, AZ | April 5, 2016 + the desire to age in place
+ housing not suitable for aging in place + streets unsafe for non-drivers + a lack of public transit options + numerous other factors (e.g. employment, distance from
family, health issues, isolation, urban and suburban sprawl)
= the reason for the AARP Livable Communities initiative and the AARP Network of Age-Friendly Communities
AARP Livable Communities presentation | American Planning Association 2016 National Planning Conference, Phoenix, AZ | April 5, 2016 “A livable community is one that is safe and secure, has affordable and appropriate housing and transportation options, and offers supportive community features and services. Once in place, those resources enhance personal independence; allow residents to age in place; and foster residents’ engagement in the communityʼs civic, economic, and social life.” — Policy Book, Chapter 9
and
AARP Livable Communities presentation | American Planning Association 2016 National Planning Conference, Phoenix, AZ | April 5, 2016 Photo from ThinkStock.com Established April 2012
Established April 12, 2012
84 communities (and counting) representing more than 44 million people
Updated April 1, 2016
AARP Livable Communities presentation | American Planning Association 2016 National Planning Conference, Phoenix, AZ | April 5, 2016 Communities in the AARP age-friendly network are not retirement villages, gated developments
< Remember Bubbi Sheila from Slide 5?
This is where she lived. It’s still around!
AARP Livable Communities presentation | American Planning Association 2016 National Planning Conference, Phoenix, AZ | April 5, 2016 Photos from a community website and iStock.com Age-Friendly Communities are “Age-Friendly Communities” ≠ “Old People Places”
Great Places for People of All Ages
AARP Livable Communities presentation | American Planning Association 2016 National Planning Conference, Phoenix, AZ | April 5, 2016 Photo from iStock.com educating, encouraging, promoting and recognizing the improvements that make cities, towns and counties more supportive of older residents and people of all ages
towns, counties and states with the age-friendly resources they need by tapping into national and global research, models and best practices
lives of adults age 50+
aarp.org/agefriendly
Why Create the
AARP Network of Age-Friendly Communities?
AARP Livable Communities presentation | American Planning Association 2016 National Planning Conference, Phoenix, AZ | April 5, 2016 The WHO Global Network of Age-friendly Cities and Communities was established in 2010 to connect cities, communities and
vision of making their community a great place to grow old in. … Cities and communities join the Network with a commitment to becoming more age- friendly and to share their experience, achievements and lessons learnt with
commitment to listen to the needs of their ageing population, assess and monitor their age-friendliness and work collaboratively with older people and across sectors to create accessible physical environments, inclusive social environments, and an enabling service infrastructure. The WHO Global Network of Age-friendly Cities and Communities currently includes 287 cities and communities in 33 countries, covering over 113 million people worldwide. (April 2016)
AARP Livable Communities presentation | American Planning Association 2016 National Planning Conference, Phoenix, AZ | April 5, 2016 ALABAMA
CALIFORNIA
COLORADO
DISTRICT OF COLUMBIA
FLORIDA
GEORGIA
MASSACHUSETTS
MICHIGAN
MINNESOTA
MISSOURI
NEVADA
NEW JERSEY
NEW MEXICO
HAWAII
ILLINOIS
IOWA
KENTUCKY
MAINE
MARYLAND
NEW YORK
NORTH CAROLINA
OHIO
OREGON
PENNSYLVANIA
TEXAS
UTAH
VERMONT
The Member List
Updated April 1, 2016
Communities join the AARP Network of Age Friendly Communities because they understand what’s coming and know they need to get ready.
For example: In 1820, Maine became the nation’s 23rd State.
Today, Maine is the oldest state in the United States.
Huh?
How can that be?
Here’s how …
The median age of Maine residents is 44.1, which means half the population is older, half younger.
Guess “the youngest” state!
Here’s the answer in tiny type: Utah, with a median at age of 30.5
AARP Livable Communities presentation | American Planning Association 2016 National Planning Conference, Phoenix, AZ | April 5, 2016 Maine members thus far …
Members as of April 1, 2016The AARP Network of Age-Friendly Communities
Bethel | Date enrolled: September 2015 Bowdoinham | Date enrolled: April 2015 Ellsworth | Date enrolled: December 2014 Greenwood | Date enrolled: March 2016 Kennebunk | Date enrolled: March 2015 Newry | Date enrolled: March 2016 Paris | Date enrolled: March 2015 Portland | Date enrolled: August 2014 Woodstock | Date enrolled: March 2016
Photo from iStock.com AARP Livable Communities presentation | American Planning Association 2016 National Planning Conference, Phoenix, AZ | April 5, 2016 Age Friendly Process
Step 1: ENTERING THE NETWORK Step 3: IMPLEMENTATION & EVALUATION (Years 3 5) Step 2: PLANNING PHASE (Years 1 - 2)
Step 4: CONTINUOUS CYCLE OF IMPROVEMENTS (Years 5+)
The Age-Friendly Cycle for Network Communities
AARP Livable Communities presentation | American Planning Association 2016 National Planning Conference, Phoenix, AZ | April 5, 2016 The AARP Network of Age-Friendly Communities Online Tool Kit
AARP Livable Communities presentation | American Planning Association 2016 National Planning Conference, Phoenix, AZ | April 5, 2016 The Age-Friendly Action Plans are rolling in!
AARP Livable Communities presentation | American Planning Association 2016 National Planning Conference, Phoenix, AZ | April 5, 2016 And work is getting done
"slow biking" group that meets for Tuesday evening rides around BIRMINGHAM,
hard for many residents to come by, NEWPORT, VERMONT, gets down and dirty in the Fresh Start Community Farm.
getting out and about by participating in the BROWNSVILLE, TEXAS, CycloBias.
Grandparents Park, adults and kids in WICHITA, KANSAS, have a nearby destination to enjoy together.
1. 2. 3. 4.
AARP Livable Communities presentation | American Planning Association 2016 National Planning Conference, Phoenix, AZ | April 5, 2016 Photos courtesy Le Tour de Ham and the Fresh Start Community Farm As the member communities move into Year 5 of the age-friendly process, they’ll be evaluating their work.
AARP Livable Communities presentation | American Planning Association 2016 National Planning Conference, Phoenix, AZ | April 5, 2016 AARP has tools and resources to help
aarp.org/livabilityindex
AARP Livable Communities presentation | American Planning Association 2016 National Planning Conference, Phoenix, AZ | April 5, 2016 << Here’s the
Livability Score for the address we’re at right now
AARP Livable Communities presentation | American Planning Association 2016 National Planning Conference, Phoenix, AZ | April 5, 2016 Housing resources and recommendations
AARP Livable Communities presentation | American Planning Association 2016 National Planning Conference, Phoenix, AZ | April 5, 2016 Photos courtesy Howard and Sharon Johnson Placemaking resources and recommendations
AARP Livable Communities presentation | American Planning Association 2016 National Planning Conference, Phoenix, AZ | April 5, 2016 Transportation resources and recommendations
AARP Livable Communities presentation American Planning Association 2016 National Planning Conference, Phoenix, AZ | April 5, 2016 AARP.org/livable and the
AARP Livable Communities e-Newsletter
AARP Livable Communities presentation | American Planning Association 2016 National Planning Conference, Phoenix, AZ | April 5, 2016 Find what you need by visiting
archives.
(And check out interview series and how-to lessons.)
AARP Livable Communities presentation | American Planning Association 2016 National Planning Conference, Phoenix, AZ | April 5, 2016 Thank you for your time and attention!
Melissa Stanton
Editor, AARP.org/Livable Advisor, AARP Livable Communities Programs Community, State and National Affairs Washington, D.C. 202-434-6767 | mstanton@aarp.org
AARP Livable Communities presentation | American Planning Association 2016 National Planning Conference, Phoenix, AZ | April 5, 2016 Mildred E. Warner
Department of City and Regional Planning Cornell University Forging Neighborhoods for All Generations April 5, 2016 APA Conference, Phoenix, AZ Contact: www.mildredwarner.org | mew15@cornell.edu
Funding provided by the USDA National Institute for Food and Agriculture APA Divisions Council Grant
Reframing the Aging and Livability Debate
Livable Communities for Aging
to renew attention to gender issues in planning?
2
Core Principles
3
Age-Friendly Cities Child-Friendly Cities
Many Common Elements
Basic Services Safe Water Safe Streets Opportunity to Play Civic Participation Family Support Protection from Exploitation Housing Transportation Services (Health) Outdoor Spaces Communication Civic and Social Participation Respect
4
Need an All-Inclusive Planning Approach
Four Questions
gender (2014), Surveys (2008, 2013, 2014)
5
Where is Current Practice?
barriers
6
What Would a Gender Lens Look Like?
services
7
Built Environment Not Optimal
8
0% 20% 40% 60% 80% Neighborhood Schools Sidewalk system connecting Park/play ground within 1/2-mile… Access to fresh food markets Public gathering spaces Retail, services, and housing mix Complete Streets Bikelane
Percent of community with more than a half of community covered
Metro Core (N=209) Suburban (N=720) Rural (N=466) Planning Across Generations Survey, 2013, 1478 city managers responding
9
Zoning Regulations Lag Behind
ICMA Planning Across Generation Survey, 2013 (1,478 city managers responding) 0% 20% 40% 60% 80%
Allow accessory dwelling units Allow mixed-use Allow child care business in residential units by right Require complete streets Allow child care centers Pedestrian-friendly design guidelines Street connections between adjacent developments Promote parks or recreation facilities in all neighborhoods Mandate sidewalk system Metropolitan (n=194) Suburban (n=675) Rural (n=360)
Service Delivery Also Lags in Suburbs and Rural Areas
10
0% 50% 100% Metro Core (N=224) Suburban (N=751) Rural (N=487)
Families with children can find range of services they need within my community Seniors can find the range of services they need within my community
Planning Across Generations Survey, 2013, 1478 city managers responding
Cross Agency Partnerships Needed
11
0% 50% 100%
Libraries Parks and recreation department School district Police department Area agency on aging Public health department Hospital or health care providers Fire department Housing agency Economic development agency Planning department Community colleges Child care resource and referral agency Transportation or highway department Metro Core (N=217) Suburban (N=672) Rural (N=418) ✓ ✓ ✓ ✓
Are any of the following engaged in cross-agency partnerships to serve children or seniors?
Planning Across Generations Survey, 2013, 1478 city managers responding
12
Can a focus on women can help meet the needs of children and elders?
Women men Face ace a Tr a Triple e Bur Burden en
Household Responsibilities Child care, Elder care Labor Force Participation Formal and Informal Spatial Constraints Separation of home and work
Gender Sensitive Land Use Actions
Comprehensive Planning
Women 2%
Aging 55%
Community Attitudes
Gender conscious Planning and zoning board Developers
Women and Aging Survey 2014 624 Planners
What i t is G Gender r Sensiti tive La Land U Use? ?
(Women en and nd A Aging ing S Sur urvey ey 2014, 2014, 624 P 624 Pla lanner nners)
What Drives Gender Sensitive Land Use?
16
Gender Rides the Aging Train
17
How do we get more attention to the needs of children and seniors in our plans?
18
Planning Across Generation Survey, 2013 (1,478 city managers)
Emergency Plan Comprehensive Plan Economic Development Plan Do You Have? 91% 77% 57% Does Your Plan Specifically Address? Seniors 66% 53% 31% Children/Youth 60% 53% 31%
What Leads to Change?
developers, planning and zoning board
and building codes
19
Services for Children and Elders Leadership Comp Plan Aging, Children Better Built Environment Broader Housing Choices Zoning
Planning Across Generation Survey, 2013 (1,478 city managers)
Engagement Elders Children
20
Planni nning ng Need eeds a Gend ender er/A /Aging ng/C /Child Lens ens
Contact:
www.mildredwarner.org/planning | mew15@cornell.edu
Funding provided by the USDA National Institute for Food and Agriculture , APA Divisions Council
Articles
Women