for all Manal J. Aboelata, MPH Managing Director Prevention - - PowerPoint PPT Presentation

for all
SMART_READER_LITE
LIVE PREVIEW

for all Manal J. Aboelata, MPH Managing Director Prevention - - PowerPoint PPT Presentation

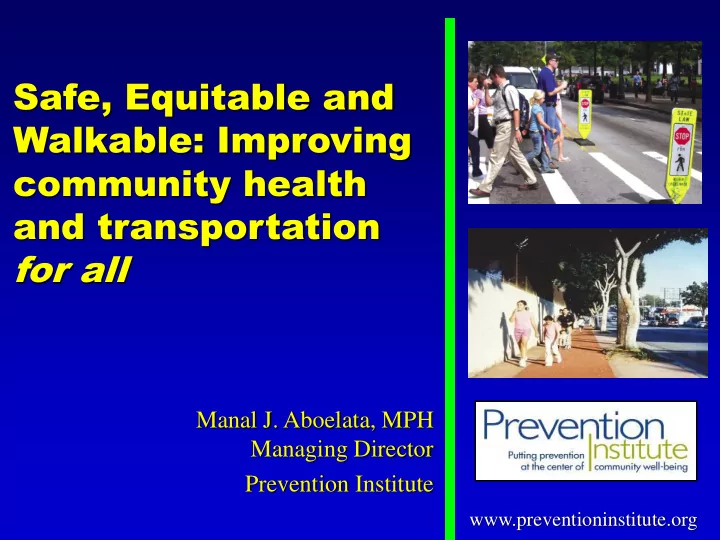
Safe, Equitable and Walkable: Improving community health and transportation for all Manal J. Aboelata, MPH Managing Director Prevention Institute www.preventioninstitute.org Image source:


slide-1
SLIDE 1

Safe, Equitable and Walkable: Improving community health and transportation for all

www.preventioninstitute.org

Manal J. Aboelata, MPH Managing Director Prevention Institute

slide-2
SLIDE 2

Image source: http://www.flickr.com/photos/metrolibraryarchive/11053027973/

slide-3
SLIDE 3

HEA EALTH LTH & & SAF AFETY ETY

BEHAV HAVIOR IOR BEHAV HAVIOR IOR

BUIL ILT ENVIR IRONME ONMENT NT

Making the Connection

slide-4
SLIDE 4
slide-5
SLIDE 5

Transit Riders + Activity

 Half of transit riders

walk at least 19 mins.

 29% get at least 30

  • mins. of activity.

 “Minorities”, low

income (income <$15k/yr.), denser urban dwellers more likely to get 30+ mins./day due to transit trips.

slide-6
SLIDE 6
slide-7
SLIDE 7

Emerging: Mental Health & Social Capital

slide-8
SLIDE 8

Behaviors & Environment 70% Medical Care, 10% Genetics 20% Prevention, 4% Medical Services 96%

$2.2 Trillion

Rapid Health Care Spending

Factors Influencing Health National Health Expenditures

SOURCE: Centers for Disease Control and Prevention, Blue Sky Initiative, University of California at San Francisco, Institute of the Future, 2000

slide-9
SLIDE 9

People’s health is st stron

  • ngly

y influen influence ced d by by th the e over erall all li life od e odds ds of

  • f

th the e ne neighb ighbor

  • rho

hood

  • d

whe here th e they ey li live. e. Inde Indeed ed, , plac place e ma matt tter ers.

  • s. In many

In many lo low- inco income me ur urba ban n an and d rur ural al co communities mmunities, , who hole le po popu pula lation tions s ar are co cons nsigne igned d to to sh shor

  • rte

tene ned, d, sic sicker er li lives es. “ ”

Source: Prevention Institute. A Time of Opportunity: Local Solutions to Reduce Inequities in Health and Safety. 2009. Residents, by Zip Code. SOURCE: The Health Atlas for the City of Los Angeles

slide-10
SLIDE 10

Crenshaw WALKS

Image courtesy S. Randal Henry, DrPH, Community Intelligence, Crenshaw Walks Co-founder 5.2015

slide-11
SLIDE 11

Addressing the Intersection

 Focus where pedestrian fatalities, asthma

and type 2 diabetes rates are highest

 Weave together strategies that reduce

inequities in health & transportation system access, quality and affordability

 Elevate neighborhood safety, the arts, and

social cohesion

 Support and facilitate transit dependent

residents

slide-12
SLIDE 12

Hou Housing sing Ar Arts ts an and Cultur d Culture Hea Health lth Car Care

A Good Solution Solves Multiple Problems

Public Public Hea Health lth Tran anspo sporta tation tion En Envir viron

  • nmen

ment / / Par arks an ks and Ope d Open n Spac Space Commu Community nity Saf Safet ety Hea Healthy lthy Foo

  • od
slide-13
SLIDE 13

Manal J. Aboelata, MPH Managing Director manal@preventioninstitute.org Sign up for our media alerts: http://www.preventioninstitute.org/alerts

www.preventioninstitute.org

Follow us on: