
SLIDE 1
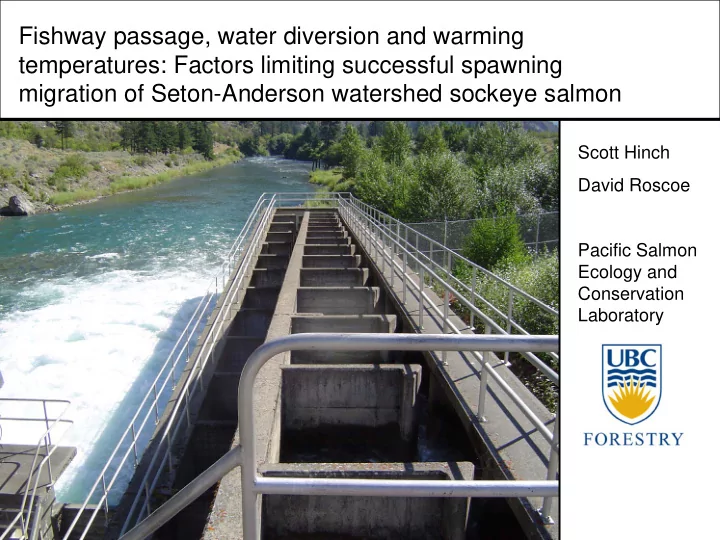
Fishway passage, water diversion and warming temperatures: Factors limiting successful spawning migration of Seton-Anderson watershed sockeye salmon
Scott Hinch David Roscoe Pacific Salmon Ecology and Conservation Laboratory
Fishway passage, water diversion and warming temperatures: Factors - - PowerPoint PPT Presentation
Fishway passage, water diversion and warming temperatures: Factors limiting successful spawning migration of Seton-Anderson watershed sockeye salmon Scott Hinch David Roscoe Pacific Salmon Ecology and Conservation Laboratory Background
Scott Hinch David Roscoe Pacific Salmon Ecology and Conservation Laboratory
Seton River Entrance Fish water sluice Exit To Seton Lake
5 10 metres
N
Seton Dam Seton Lake Fishway Cayoosh Diversion Dam Fraser River Hydro canal Power house Cayoosh Creek Seton Creek 1000 m
N
1 2 3 4,5 6-8 10 9
Fraser River Lillooet, B.C. 20 km
N
Anderson Lake Seton Lake Seton Dam
Gates Stock Spawning Area 11 12 13 14 15 17 16 10
50 100 150 200 250 300 350 400 450
Males Females Cortisol ( ng/ m L)
1 2 3 4 5 6 7 8 9 10
Males Females
Glucose ( m m ol/ L)
0.5 1 1.5 2 2.5 3
Males Females Lactate ( m m ol/ L)
250 260 270 280 290 300 310 320
Males Females Osm olality ( m m ol/ L)
Survival to spawning grounds was greater for males (71%
No significant difference in survival between fish held for recovery and those released immediately.
Fish released upstream of dam Fate # % Successful migrant 26 93 Failed in Lake 2 7 Total 28 Fish released downstream of dam Fate # % Successful migrant 27 48 Failed in Lake 10 18 Failed at dam/fishway 10 18 Did not reach dam 8 14 Fishery removal 1 2 Total 56
Total loss = 52%
10 20 30 40 50 60 70 80 90 100 Attraction Passage
Efficiency ( % )
100% 93% 77% 86% 2005 2007 2005 2007 n=30 n=51 n=23 n=44
10 20 30 40 50 60 70 10 20 30 40 50 60 70 Dam spill discharge (m 3/ s) 10 20 30 40 50 60 70 80 90 100 Attraction efficiency (% )
10 6 5 36 4 13 6 8 48 5
Below dam delay (hrs)
2 4 6 8 10 12 14 16 18 20 22 20-Aug 22-Aug 24-Aug 26-Aug 28-Aug 30-Aug 1-Sep Temperature (
Arrival at spawning grounds Portage Creek Release into Seton Lake Anderson Lake 2 4 6 8 10 12 14 16 18 20 21-Aug 23-Aug 25-Aug 27-Aug 29-Aug 31-Aug Temperature (oC) Portage Creek Anderson Lake Arrival at spawning grounds Release into Seton Lake
F r a s e r R i v e r Portage Creek
N
Anderson Lake Seton Dam Spawning grounds Seton Lake
Important questions to study:
hydraulics and attraction?
Can flow patterns (hence migration cues) be favourably altered via changes in water release at siphons?
Entrance Attraction flow Siphons
20,000 40,000 60,000 80,000 100,000 120,000
1950 1960 1970 1980 1990 2000 2010
# of spaw ners
2004 cycle 2005 cycle 2006 cycle 2007 cycle
Least Concern (no decline) Vulnerable (30% decline 3 generations) Endangered (50% decline) Critically Endangered (80% decline) Extinct in Wild Extinct
IUCN)
Bonnie Adolph, Elijah Michel, Terry Adolph
UBC Pacific Salmon Ecology & Conservation group: Lucas Pon, Marika Gale, Glenn Crossin,Ken Jeffries, Andrew Lotto
David Patterson, Jayme Hills
Steve Cooke - Carleton University