
SLIDE 1
Financial Assets and Liabilities, U.S. Nonfinancial Corporations 32 - - PDF document
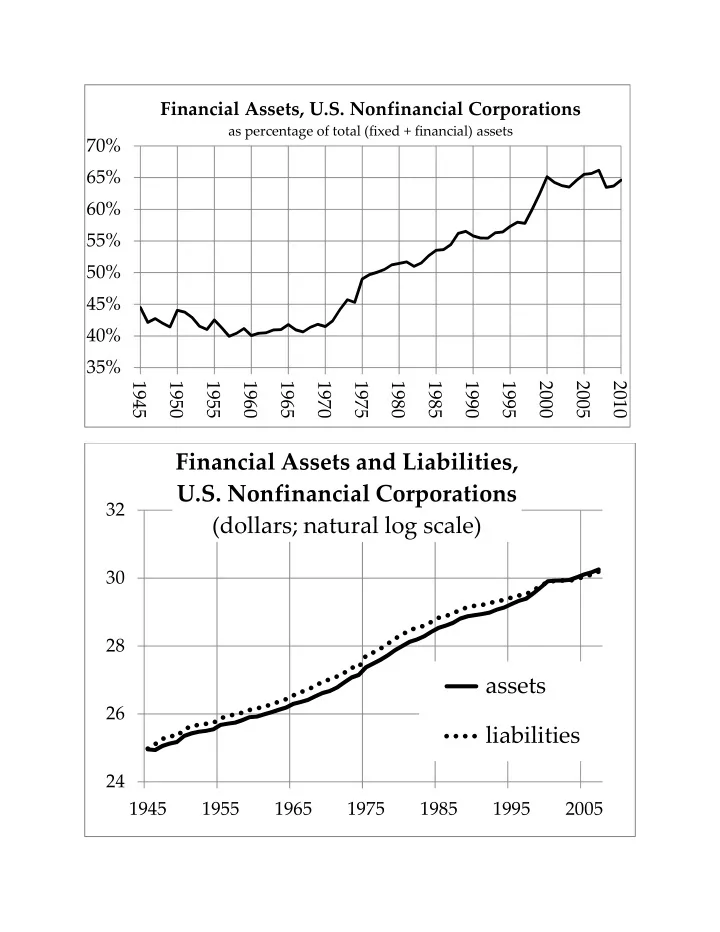
Financial Assets, U.S. Nonfinancial Corporations as percentage of total (fixed + financial) assets 70% 65% 60% 55% 50% 45% 40% 35% 1945 1950 1955 1960 1965 1970 1975 1980 1985 1990 1995 2000 2005 2010 Financial Assets and