
SLIDE 1
Figure 1 – Household satisfaction with retailer measures
1
67 64 69 63 51 51 58 54 61 59 66 62
Survey 1 Survey 2 Survey 3 Survey 4 Overall satisfaction Customer Service Billing
Electricity Gas
67 64 69 63 65 62 67 57 68 65 70 62
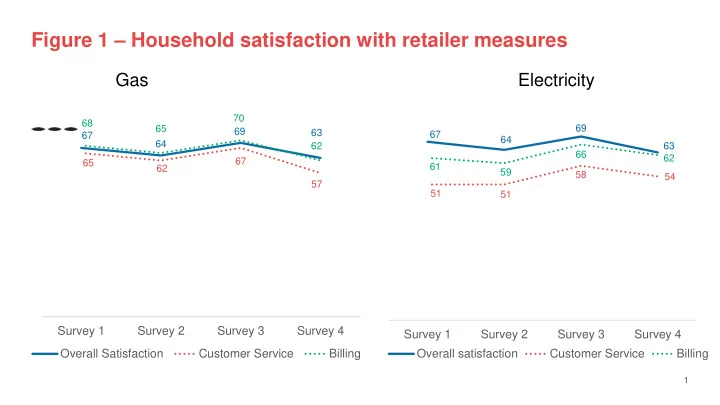
Figure 1 Household satisfaction with retailer measures Gas - - PowerPoint PPT Presentation
Figure 1 Household satisfaction with retailer measures Gas Electricity 70 68 65 69 69 63 67 67 64 64 62 63 66 62 67 65 61 62 59 58 54 57 51 51 Survey 1 Survey 2 Survey 3 Survey 4 Survey 1 Survey 2 Survey 3
1
67 64 69 63 51 51 58 54 61 59 66 62
67 64 69 63 65 62 67 57 68 65 70 62
2
61 65 68 57 67 64 69 63
66 69 74 64 68 64 59 53
3
67 62 71 64 66 61 64 67 66 69
73 67 74 67 64 58 65 59 72 70 73 60
4 67 64 69 63 28 30 26 32 5 5 5 5 Survey 1 Survey 2 Survey 3 Survey 4 Positive Neutral Negative
61 65 68 57 34 32 26 38 5 4 6 5 Survey 1 Survey 2 Survey 3 Survey 4 Positive Neutral Negative
5 41 (-8) 39 (-2) 40 (-9) 50 (-6) 33 (-1) 39 33 (+5) 39 (-9) 11 (-4) 17 (-11) B H NSW Vic Qld SEQ WA SA Tas ACT Positive Neutral Negative
6 40 41 49 39 39 35 33 39 22 24 19 22 Survey 1 Survey 2 Survey 3 Survey 4 Positive Neutral Negative
7
8
9
34 (-8) 51 (-5) 62 (0) 69 (-1) 58 (0) 71 (+2) 66 (+3)
10 46 42 48 34 44 46 39 43 11 12 12 22 Survey 1 Survey 2 Survey 3 Survey 4 Positive Neutral Negative
11 56 56 63 51 36 37 30 33 7 7 7 16 Survey 1 Survey 2 Survey 3 Survey 4 Positive Neutral Negative
12 63 (-7) 70 (-3) 74 (+2) 71 (-2) 75 (0) 76 65 (-7) 48 (-21) 68 (-3) 73 (-12) B H NSW Vic Qld SEQ WA SA Tas ACT Positive Neutral Negative
13 63 (-3) 61 (+1) 64 (+4) 63 (+4) 62 (+3) 66 65 (+2) 45 (-11) 68 (+5) 64 (-5) B H NSW Vic Qld SEQ WA SA Tas ACT Positive Neutral Negative
14 75 73 74 70 18 20 18 19 7 7 8 11 Survey 1 Survey 2 Survey 3 Survey 4 Positive Neutral Negative
15 64 60 62 61 28 32 30 29 7 8 8 10 Survey 1 Survey 2 Survey 3 Survey 4 Positive Neutral Negative
16 46 (-4) 36 (-13) 34 (-21) 32 (-16) 41 (-8) 42 46 (-7) 29 (-14) 43 (+2) 34 (-20) B H NSW Vic Qld SEQ WA SA Tas ACT Positive Neutral Negative
17 50 41 45 36 38 44 38 41 12 15 16 24 Survey 1 Survey 2 Survey 3 Survey 4 Positive Neutral Negative
18
19 43 (-4) 34 (-12) 30 (-21) 34 (-12) 35 (-9) 35 43 (-9) 33 (-10) 33 (-3) 35 (-15) B H NSW Vic Qld SEQ WA SA Tas ACT Positive Neutral Negative
20 48 46 45 34 42 41 40 44 10 12 15 22 Survey 1 Survey 2 Survey 3 Survey 4 Positive Neutral Negative
21 54 55 57 57 57 59 53 53 41 47 49 46 45 45 51 52 47 44 43 36 47 42 43 43 44 29 44 42 40 29 38 21 21 20 19 20 30 20 19 11 B H NSW Vic Qld SEQ WA SA Tas ACT Ability Information Tools In the market
22 63 64 69 55 32 30 27 34 5 5 4 11 Survey 1 Survey 2 Survey 3 Survey 4 Positive Neutral Negative
23 51 50 57 46 39 40 34 38 10 10 9 16 Survey 1 Survey 2 Survey 3 Survey 4 Positive Neutral Negative
24 48 48 53 42 41 41 38 43 11 11 9 15 Survey 1 Survey 2 Survey 3 Survey 4 Positive Neutral Negative
25 38 (-3) 21 (-9) 21 (-11) 20 (-14) 19 (-9) 20 30 (-6) 20 (-13) 19 (+1) 11 (-11) B H NSW Vic Qld SEQ WA SA Tas ACT Positive Neutral Negative
26 32 30 33 21 42 43 41 38 26 28 26 41 Survey 1 Survey 2 Survey 3 Survey 4 Positive Neutral Negative
27 53 (-4) 56 (-3) 55 (-8) 56 (-7) 60 (+2) 60 56 (-3) 56 (+2) 55 (0) 45 (-6) B H NSW Vic Qld SEQ WA SA Tas ACT Positive Neutral Negative
28 3 3 5 2 3 2 3 3 3 5 34 26 41 34 37 34 24 36 33 23 39 37 35 40 37 40 34 34 35 39 25 33 20 24 23 24 39 27 29 32 ACT TAS SA WA QLD SE QLD VIC NSW Households Business Don't know Not at all familiar Not very familiar Familiar/Very familiar