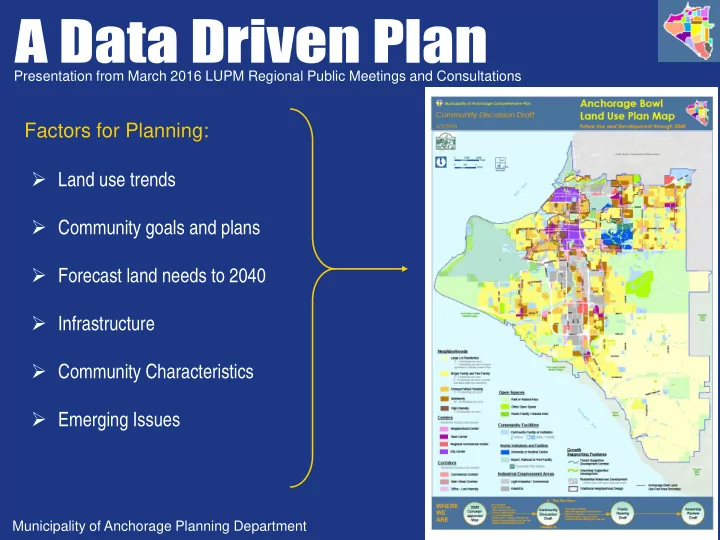
Factors for Planning: Land use trends Community goals and plans - - PowerPoint PPT Presentation

factors for planning land use trends community goals and
SMART_READER_LITE
LIVE PREVIEW

Factors for Planning: Land use trends Community goals and plans - - PowerPoint PPT Presentation

Presentation from March 2016 LUPM Regional Public Meetings and Consultations Factors for Planning: Land use trends Community goals and plans Forecast land needs to 2040 Infrastructure Community Characteristics Emerging


slide-1
SLIDE 1

1

1

  • Land use trends
  • Community goals and plans
  • Forecast land needs to 2040
  • Infrastructure
  • Community Characteristics
  • Emerging Issues

Factors for Planning:

Presentation from March 2016 LUPM Regional Public Meetings and Consultations Municipality of Anchorage Planning Department

slide-2
SLIDE 2

2

2

  • More development in existing centers
  • More infill housing near jobs

Town Center

slide-3
SLIDE 3

3

Area-specific Plans in Anchorage Bowl

3

Since 2006:

  • East Anchorage Plan
  • West Anchorage Plan
  • Hillside District Plan
  • Downtown Plan
  • Fairview Plan
  • Government Hill Plan
  • Ship Creek Plan
  • 3500 Tudor Master Plan
  • U-Med Plan Update
  • Pending plans:
  • Mountain View Plan
  • Spenard Corridor Plan
slide-4
SLIDE 4

4

4

The Downtown Plan (2007) has 7 land use categories.

slide-5
SLIDE 5

5

5

Fairview’s Plan has 13 categories including “Fairview Mixed-use Corridor”.

slide-6
SLIDE 6

6

6

Downtown – 7 types East Anchorage – 16 types Fairview – 13 types Hillside – 11 types Categories are more general in the Anchorage Bowl Land Use Plan Map. The Bowl Land Use Plan refers readers to the area specific plans for details.

slide-7
SLIDE 7

7

7

From Section 2 of LUPM narrative

slide-8
SLIDE 8

8

Urban Single-family 40% Deficiency Commercial Deficiencies in

  • Midtown
  • Dimond

Institutional, Parks and Other Facility Needs

Multifamily Land Capacity 50% Deficiency Industrial Land Deficit: 25% - 50%

Commercial Lands Assessment 2012 Industrial Lands Assessment 2015 Housing Market Analysis - 2012 Findings

Vacant Land Capacity

8

slide-9
SLIDE 9

9

9

Updated, Low-to-Medium/High ‘Range’ Forecast, 2015 - 2040 Low Baseline Medium/High Population (Bowl) 15,000 37,000 45,000 Households (Bowl) 9,000 18,000 21,000 Employment (Municipality) 15,000 35,000 44,000

slide-10
SLIDE 10

10

10

Structure Type Vacant Land Capacity (Dwellings) Projected Housing Demand Sufficiency (capacity - demand) Large Lot Single Family 1,618 840 778 Single Family 3,519 7,140 (3,621) “Compact” Single Family 470 1,050 (580) Two Family / Duplex 1,150 3,780 (2,630) Townhouse 745 1,680 (935) Multifamily / Other 2,209 6,510 (4,301) Total 9,712 21,000 Total "surplus units"

  • 778

Total "deficit units"

  • (12,067)

Updated Residential Vacant Land Sufficiency, Anchorage Bowl, 2015-2040

slide-11
SLIDE 11

11

Industrial Lands Assessment (2015) 11

Industrial Uses in Context:

  • Anchorage Bowl will be preferred location
  • Industrial users seek least cost locations due to high production costs
  • Industrial development cannot “build upward” like office or mixed-use
slide-12
SLIDE 12

12

12

Anchorage Bowl’s “Traded” Sectors :

  • Highest export revenue per job/acre
  • Higher average wages
  • Capitalize on local competitive advantages in global economy

Industrial:

  • Manufacturing
  • Air and water transportation
  • Professional, scientific, technical services

Commercial Office:

  • Petroleum and Mining
  • Real estate/property services
  • Professional, scientific, technical services
  • Health and Medical
slide-13
SLIDE 13

13

13 Bowl Bowl Anchorage Industrial Land Need Factor "High Range" "Low Range" Anchorage Bowl Buildable I-Zoned Supply 232 133 + Anchorage Bowl Redevelopable 208 208 = Total Anchorage Bowl I-Zoned Capacity 440 341

  • Gross Land Need to 2040

492 492 = Anchorage Bowl Net Traded Sector Capacity (52) (151) + Chugiak-Eagle River Buildable I-Zoned Supply 187 187 = MOA I-Zoned Capacity Net of Traded Sector Need 135 36

  • Non-Traded Sector Gross Land Need to 2040

233 233 = 25-Year Net I-Zoned Land Capacity (98) (198)

SOURCES: 2015 Anchorage Industrial Land Assessment Update: Volume II, Tables 25, 27, 28

Updated Industrial Land Sufficiency, Anchorage Bowl, 2015-2040

slide-14
SLIDE 14

14

14

  • Existing and Planned Parks
  • Future Streets
  • Water/Wastewater Capacity
  • K-12 School Capacity

Open Space Planning Factor Map

slide-15
SLIDE 15

15

15

  • Sidewalks
  • Trails
  • Public Transit
  • Mix of Land Uses

Sidewalks Planning Factor Map

slide-16
SLIDE 16

16

16

  • Streams and Watersheds
  • Important Wildlife Habitats
  • Community Preference for Natural

Open Spaces

Natural Assets Planning Factor Map

slide-17
SLIDE 17

17

  • Neighborhood Contexts
  • Transit Oriented Characteristics
  • Natural Hazard Mitigation

Neighborhood Character Planning Factor Map

slide-18
SLIDE 18

18

18

5

  • Reinvestment Focus Areas
  • Infill Housing Regulations
  • Targeted Area Rezonings
  • Industrial Zone Regulations
  • Infrastructure Investments
  • Permit Review Assistance

ImplementationActions

Areas of Growth Targeted Rezones

slide-19
SLIDE 19

19

19

From Section 3 of LUPM narrative

slide-20
SLIDE 20

20

20

From Section 3 of LUPM narrative

slide-21
SLIDE 21

21

21

  • Houses on Standard Lots
  • Small-Lot Housing
  • Accessory Dwellings
  • “Big House” with 2-3 Units

Compact / Mixed Housing Neighborhoods Land Use Designations – Example Illustrations

slide-22
SLIDE 22

22

22

  • Attached Single-family
  • Townhouses
  • Small Multi-family

Compact / Mixed Housing Cont’d Land Use Designations – Example Illustrations

slide-23
SLIDE 23

23

23

  • Compact Housing Types, and…
  • Townhouses
  • Multifamily

Multifamily Neighborhoods Land Use Designations – Example Illustrations

slide-24
SLIDE 24

24

24

  • Neighborhood Center
  • Town Center

Centers Land Use Designations – Example Illustrations

slide-25
SLIDE 25

25

25

  • Commercial Corridor

Corridors Land Use Designations – Example Illustrations

slide-26
SLIDE 26

26

26

  • Main Street Corridor

Corridors Land Use Designations – Example Illustrations

slide-27
SLIDE 27

27

27

  • On Main Streets
  • In Centers
  • In Multifamily Neighborhoods

Residential Mixed-use Development Land Use Designations – Example Illustrations