
SLIDE 1
BIKE ANCHORAGE
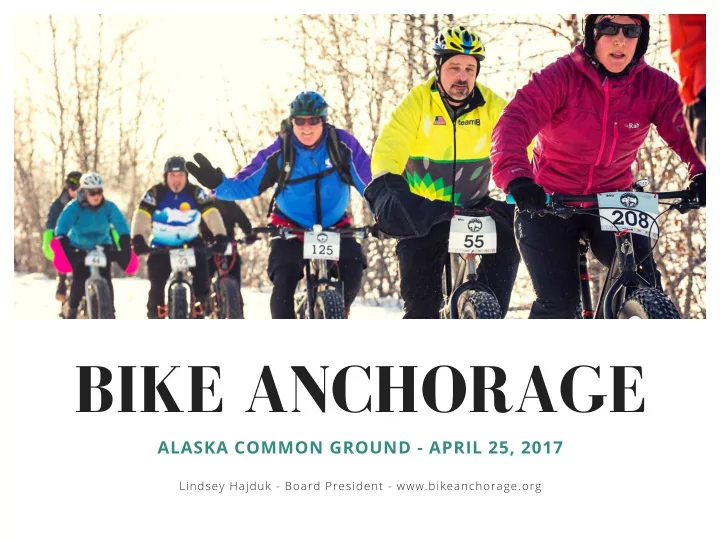
ALASKA COMMON GROUND - APRIL 25, 2017
Lindsey Hajduk - Board President - www.bikeanchorage.org
BIKE ANCHORAGE ALASKA COMMON GROUND - APRIL 25, 2017 Lindsey Hajduk - - PowerPoint PPT Presentation
BIKE ANCHORAGE ALASKA COMMON GROUND - APRIL 25, 2017 Lindsey Hajduk - Board President - www.bikeanchorage.org ABOUT BIKE ANCHORAGE Our Core Purpose: Make Anchorage Bicycle Friendly. Our Values: 01. Community 02. Safety 03. Equal
ALASKA COMMON GROUND - APRIL 25, 2017
Lindsey Hajduk - Board President - www.bikeanchorage.org
Our Core Purpose: Make Anchorage Bicycle Friendly. Our Values:
ENCOURAGEMENT
Bike to Work Days, Winter Bike Fest, Big Fat Ride, Community Rides, and more!
EDUCATION
Anchorage GRIT (Girls Riding Into Tomorrow), Bike Safety Classes, Safe Routes to School
ADVOCACY
Vision Zero Anchorage, Bike Plan Implementation
Every year we coordinate dozens of businesses and organizations that support a more bike friendly community. They host morning treat stations to encourage people to go by bike. Sign up today! This year's Bike to Work Day is Wednesday, May 17th.
GOALS
2ND AND 4TH THURSDAY JUNE - AUGUST In partnership with the Anchorage Museum Share low-flow traffic cut-throughs and shortcuts Learn about our city through a unique cycling theme. Connect community through new friendships and shared experiences
2015 The Bike Anchorage Board adopted the Vision Zero Initiative as a priority. 2016 Mayor Berkowitz launched Anchorage's
steering committee and a coalition. Visit www.muni.org/visionzero
Vision Zero Goal: Reduce the loss
roadways to ZERO.
National Highway Traffic Safety Administration. www.nhtsa.gov Municipality of Anchorage Traffic Data Management System. http://traffic.muni.org/TSReports.aspx
PRIMARY MODE OF TRAVEL
ANCHORAGE 2014
DEATHS BY MODE OF TRAVEL
ANCHORAGE 2010-2014
n=81. Regional Household Travel Survey (2014) www.muni.org/departments/OCPD/Planning/AMATS/Documents National Highway Traffic Safety Administration www.nhtsa.gov
Motorcycle 1% Car, Truck 93% Bus 2% Bicycle 2% Pedestrian 2%
Motorcycle 11% Car, Truck 48% Bicycle 6% Pedestrian 35%
Bicyclist and pedestrians make up nearly 5% of all commuters, but suffer 41% total traffic fatalities. Anchorage fatality rate = 2.2 per 100,000 (Statewide = 1.4; National average = 1.7) Where: High-crash locations are on higher speed arterials in midtown and downtown. When: During the AM and PM rush hours. Who: Alaska Native population is 7%, but they suffer over 25% fatalities and serious injuries. How: Most collisions result from a failure
careless and erratic driving. Only 2% of recorded collisions result from bicycle or pedestrian error.
5 Year average of AHTSA Fatality Analysis Reporting System MOA, Traffic Data Management System, 2009-2013 data
ABOUT BICYCLISTS AND PEDESTRIANS
ANCHORAGE BICYCLE PLAN Finalized in 2010. VISION ZERO'S FIVE E'S MORE VISION ZERO PROJECTS In 2017, we are moving to create an integrated Bicycle, Pedestrian (2007), and Trail (1997) Plan.
Existing Road Conditions Inventory Code Assessment Complete Streets Policy Context Sensitive Solutions strategy Open Data portal (now online)
"...BACON STATION!" ...it is a great way to run into friends." ...to control my diabetes and fitness." ...I <3 this city. I <3 the outdoors." ...I love the environment and it's fun!" ...for exercise." ...I love the wind in my face." ...parking my bike is way more fun downtown." ...I live here and have a bike. And the kids love it." ...the trails are some of the best in the world." ...my Subaru could die any day now." ...cuz it's awesome"
FOR MORE INFO, VISIT: WWW.BIKEANCHORAGE.ORG
Photo credits: Andy Romang, Shannon Kuhn, @anchorage_grit, Oscar Avellaneda-Cruz