Experimental Study of Dropwise Condensation on various S.A.M - - PDF document

β–Ά
experimental study of dropwise condensation on various s
SMART_READER_LITE
LIVE PREVIEW

Experimental Study of Dropwise Condensation on various S.A.M - - PDF document

Transactions of the Korean Nuclear Society Virtual Spring Meeting July 9-10, 2020 Experimental Study of Dropwise Condensation on various S.A.M condenser tubes Su-Bin Jeong a , Ha-Yeol Kim a , Myeong-Chan Park a , Young-Hun Shin b , Woonbong Hwang


slide-1
SLIDE 1

Experimental Study of Dropwise Condensation on various S.A.M condenser tubes

Su-Bin Jeong a, Ha-Yeol Kim a, Myeong-Chan Park a, Young-Hun Shin b, Woonbong Hwang b, Kwon-Yeong Lee a* Division of Mechanical Control Engineering, Handong Global Univ., Pohang, Gyungbuk, Republic of Korea Division of Mechanical Engineering, POSTECH, Pohang, Gyungbuk, Republic of Korea Corresponding author: kylee@handong.edu

  • 1. Introduction

Condensation has been considered as one of the most important thermal hydraulic phenomena during energy cycle in power plants. Condenser inside the plant changes the phase of exhaust steam into liquid in order to fulfill the condensed water with enough heat to spin the turbine efficiently. The goal of the experiment was to check condensation heat transfer enhancement by inducing dropwise condensation. Surface modification elongates the duration of dropwise condensation before water film covers the surface of condenser tubes. Ji et al. had conducted an experiment with Aluminum tube [1]. Therefore, two additional types of condenser tubes: stainless steel (SUS) and copper have been tested for the experiment in order to compare condensation efficiency among different materials.

  • 2. Methods and Results

2.1 S.A.M surface modification For this experiment, 1-inch diameter heat tube with length of 500mm are made of two different materials: copper and SUS. Surfaces of both condenser tubes were modified through S.A.M(Self-assembled monolayer)

  • method. [2][3]

S.A.M has three processes of surface modification, which are etching, oxidation, and HDFS (hydrophobic) coating. First, remove foreign substances and passivation layer from metal surface through etching process. And

  • xidation process forms a micro/nano structure on the

metal surface. Finally, the hydrophobic solution is coated to surface and form a super-hydrophobic surface. Because copper and SUS differ in their reactivity to the solution, some differences appear in the SAM surface

  • structure. In the case of copper, nanostructures are piled

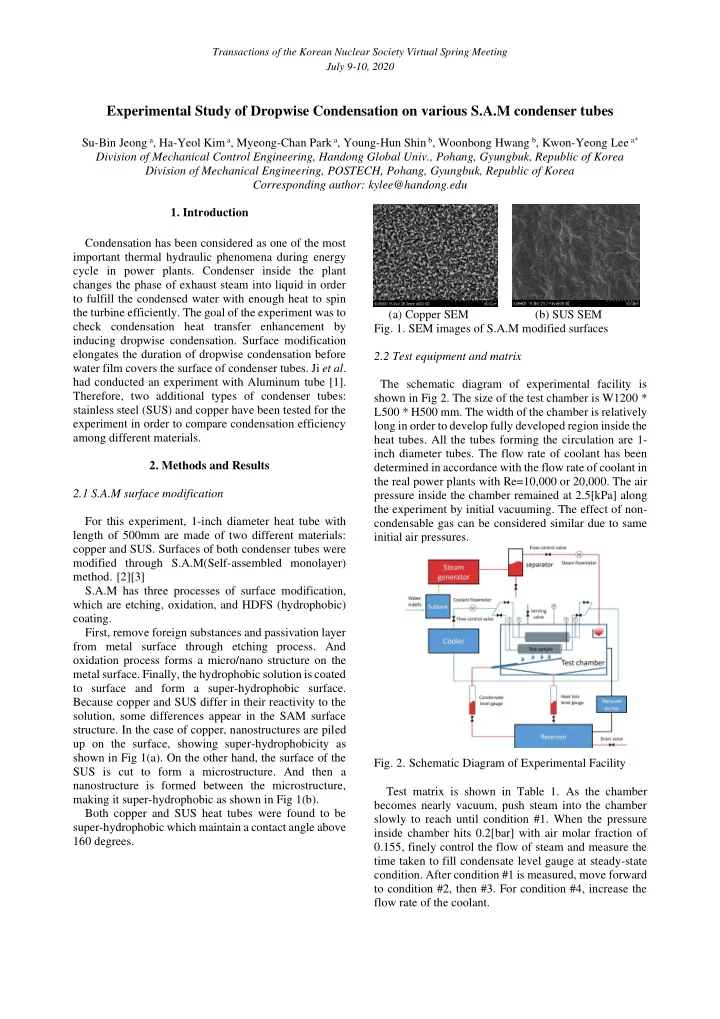
up on the surface, showing super-hydrophobicity as shown in Fig 1(a). On the other hand, the surface of the SUS is cut to form a microstructure. And then a nanostructure is formed between the microstructure, making it super-hydrophobic as shown in Fig 1(b). Both copper and SUS heat tubes were found to be super-hydrophobic which maintain a contact angle above 160 degrees. (a) Copper SEM (b) SUS SEM

  • Fig. 1. SEM images of S.A.M modified surfaces

2.2 Test equipment and matrix The schematic diagram of experimental facility is shown in Fig 2. The size of the test chamber is W1200 * L500 * H500 mm. The width of the chamber is relatively long in order to develop fully developed region inside the heat tubes. All the tubes forming the circulation are 1- inch diameter tubes. The flow rate of coolant has been determined in accordance with the flow rate of coolant in the real power plants with Re=10,000 or 20,000. The air pressure inside the chamber remained at 2.5[kPa] along the experiment by initial vacuuming. The effect of non- condensable gas can be considered similar due to same initial air pressures.

  • Fig. 2. Schematic Diagram of Experimental Facility

Test matrix is shown in Table 1. As the chamber becomes nearly vacuum, push steam into the chamber slowly to reach until condition #1. When the pressure inside chamber hits 0.2[bar] with air molar fraction of 0.155, finely control the flow of steam and measure the time taken to fill condensate level gauge at steady-state

  • condition. After condition #1 is measured, move forward

to condition #2, then #3. For condition #4, increase the flow rate of the coolant.

Transactions of the Korean Nuclear Society Virtual Spring Meeting July 9-10, 2020

slide-2
SLIDE 2

Table 1. Test Matrix

Coolant flow Pressure (air molar fraction)

Re No. 10,000 Re No. 20,000 0.2 bar (0.155) Condition #1

  • 0.4 bar (0.078)

Condition #2 Condition #5 0.6 bar (0.052) Condition #3 Condition #4 By evaluating the filling speed of condensed water from each tube, overall heat transfer coefficient can be induced. Calculation process is followed. 2.3 Calculation Process The equation (1) is the most widely used method to calculate heat transfer rate that condensation occurs on the surface of a condenser tube where coolant flows inside it. 𝑅 = 𝑛 βˆ— π‘‘π‘ž βˆ— (π‘ˆ

𝑝𝑣𝑒 βˆ’ π‘ˆ 𝑗)

(1) In this equation Ξ”T is the temperature difference of the coolant measured at both ends of the test tube. However, in this experiment, the values of this Ξ”T are too small to be used meaningfully due to the uncertainty

  • thermocouples. So, the following modified latent heat

expression (eq. (3)) is used to calculate the heat rate from

  • eq. (2).

𝑅 = 𝑛 βˆ— βˆ†β„Žπ‘”π‘•

βˆ—

(2) βˆ†β„Žπ‘”π‘•

βˆ—

= β„Žπ‘”π‘• + π·π‘ž.𝑔 (π‘ˆ

𝑑𝑏𝑒 βˆ’ π‘ˆ 𝑑𝑣𝑠𝑔)

(3) Temperature measurements on the surface of the tube are required to use the above expressions. However, because of the characteristic of the surface coating tube, attaching a thermocouple to the surface can destroy its

  • structure. In addition, the test tubes are installed
  • horizontally. So, iteration method is used with assumed

surface temperature to obtain the calculated surface temperature and then derive the heat transfer coefficient shown in eq. (4). 𝑉 = 𝑅 𝐡𝑑𝑣𝑠𝑔 Γ— π‘ˆ

π‘€π‘π‘ˆπΈ

(4) The condensation heat transfer coefficient can be

  • btained from eq. (5).

1 π‘†π‘‘π‘π‘œπ‘’ = 1 1 𝑉 βˆ’ 1 β„Žπ‘‘π‘π‘œπ‘€ (𝐸𝑗 𝐸𝑝 ) βˆ’ π‘š π‘œ (𝐸𝑝 𝐸𝑗 ) 2𝑙π‘₯ 𝐸𝑝 = β„Žπ‘‘π‘π‘œπ‘’ (5) Finally, a new heat rate 𝑅′ is derived. 𝑅′ = 1 π‘†π‘‘π‘π‘œπ‘’ 𝐡𝑑𝑣𝑠𝑔 (π‘ˆ

𝑑𝑏𝑒 βˆ’ π‘ˆ 𝑑𝑣𝑠𝑔)

(6) Later, the overall heat transfer coefficient U is calculated through the iteration process until the difference between Q and 𝑅′ is less than 0.1%. The process is described as a flowchart in Fig. 3.

  • Fig. 3. Iteration programming flowchart [1]

2.4 Experimental Results Two repetitive experiments were conducted in order to gain better precision. The average values of results are shown on Fig. 4 and 5.

  • Fig. 4. Average values of heat transfer coefficient of

copper condenser tubes Modified tubes showed better efficiency than the bare

  • ne. Zero values from bare tube for condition #1 is the

case when the condensed water did not reach to 100[ml] until 10 minutes. At conditions #2 and #3, 117% and 30%

  • f improved performance were found respectively. With

higher Reynolds number, still showed 41% of improved

Transactions of the Korean Nuclear Society Virtual Spring Meeting July 9-10, 2020

slide-3
SLIDE 3
  • performance. However, at condition #5, S.A.M showed
  • nly 3.7% of better performance which was the lowest.
  • Fig. 5. Average values of heat transfer coefficient of

SUS condenser tubes Similarly, in Fig. 5, SUS tubes showed better efficiencies except for condition #5. At condition #1, 70%

  • f improvement, and conditions #2 and #3, 48% of

improved condensation rate were performed. At conditions #4 and #5, 22% and -6% of improved performances have been observed. For both copper and SUS tubes, at condition #5, the modified tubes showed somewhat degraded

  • performances. This kind of performance degradation has

been defined as attached condensation from previous Aluminum case [1]. Attached condensation is a type of condensation when the ratio between the surface pressure and vapor pressure is too high, and the droplets rather pushed into the gaps of the nano-structure. Thus, the performance gets degraded significantly. Attached condensation of Aluminum heat tubes occurred when supersaturation ratio (S=

𝑄𝑀 𝑄𝑑) exceeds over 8.7. Milijkovic

et al. utilized supersaturation ratio as a factor to distinguish condensation type [4]. 𝑄

𝑀 is the pressure of

vapor and 𝑄

𝑑 is the pressure of surface of tube. Copper

and SUS induced condensation heat transfer degradation when supersaturation ratios were 7.89 and 3.46

  • respectively. The supersaturation ratios show that copper

has better tendency of resisting against degradation. Jo et al. demonstrated this degradation from critical gap size [5]. When the droplets get smaller than critical gap size during nucleation, the droplets get stuck in the gap, remaining as heat resistance. Since the nano structure of copper surface has smaller gap size than that of SUS, supersaturation ratio had to be higher for copper.

  • Fig. 6. Overall heat transfer coefficient comparison

among copper, SUS, and aluminum S.A.M tubes

  • 3. Conclusions

Both copper and SUS showed somewhat similar enhancement by surface modification (Fig. 6). Performance degradation from attached condensation also happened corresponding to aluminum tube. However, between condition #4 and #5, the pressure difference was too large to investigate performance degradation profoundly. The surface modification methods and characteristics of materials are different, conditions of investigation should also be varied. For a further study, Section between condition #4 and #5 should be more divided into several conditions in order to investigate. REFERENCES

[1] D.Y. Ji, J.W. Lee, W. Hwang, K.W. Lee, Experimental study of condensation heat transfer on a horizontal aluminum tube with superhydrophobic characteristic, Heat and Mass Transfer 134 (2019) 286-295 [2] X. Chen, L. Kong, D. Dong and G. Yang, Fabrication of Functionalized Copper Compound Hierarchical Structure with Bionic Superhydrophobic Properties, J. Phys. Chem. C (2009), 113, 14, 5396-5401 [3] B. Park, W. Hwang, A facile fabrication method for corrosion-resistant micro/nanostructures on stainless steel surfaces with tunable wettability, Scripta Materialia 113 (2016) 118-121 [4] N. Milijkovic, R. Enright, Y. Nam, K. Lopez, N. Dou, J. Sack, E. N. Wang. Jumping-droplet-enhanced condensation on scalable superhydrophobic nanostructured surfaces, Nano letters 13 (2012) 179-187 [5] H. Jo, K. W. Hwang, D. Kim, M. Kiyofumi, H. S. Park, M.

  • H. Kim, H. S. Ahn, Loss of superhydrophobicity of

hydrophobic micro/nano structures during condensation, Scientific reports 5 (2015) 9901 Transactions of the Korean Nuclear Society Virtual Spring Meeting July 9-10, 2020