Every Student, Every School, Every Year The arts can help students - - PowerPoint PPT Presentation

every student every school every year
SMART_READER_LITE
LIVE PREVIEW

Every Student, Every School, Every Year The arts can help students - - PowerPoint PPT Presentation

A RTS E DUCATION R ESEARCH I NITIATIVE Measuring the Status of Arts Education in Washington State Public Schools Every Student, Every School, Every Year The arts can help students become tenacious, team-oriented problem solvers who are


slide-1
SLIDE 1

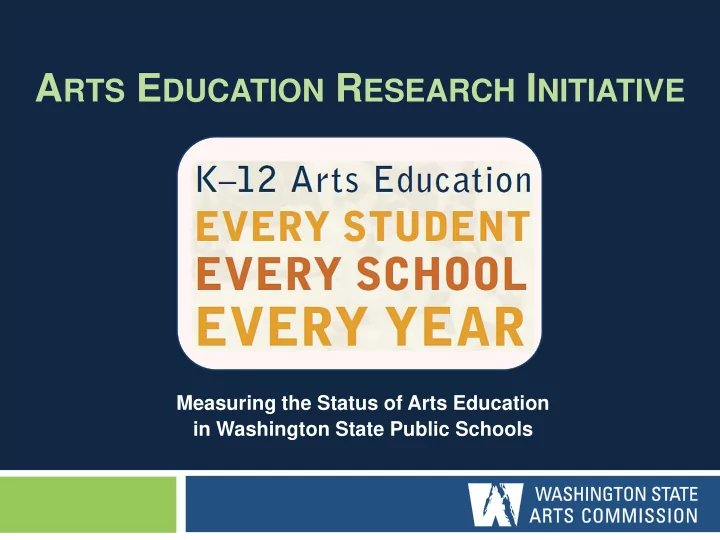
ARTS EDUCATION RESEARCH INITIATIVE

Measuring the Status of Arts Education in Washington State Public Schools

slide-2
SLIDE 2

Every Student, Every School, Every Year

“The arts can help students become tenacious, team-oriented problem solvers who are confident and able to think creatively.” – Arne Duncan,

U.S. Secretary of Education

slide-3
SLIDE 3

Every Student, Every School, Every Year

Though the arts are recognized as a core academic subject in Washington State and across the nation, K-12 arts education is fraught with inequities.

slide-4
SLIDE 4

AERI – Rationale

Current Status:

 WA has good arts policy  There is a gap between policy and practice

Needs:

 Students need more & better arts education  Education stakeholders and policy makers need

more & better data to collectively work towards this goal

slide-5
SLIDE 5

Primary Areas of Inquiry

 Frequency and Intensity of Instruction  Curriculum  Assessment  Staffing and Professional Development  Collaboration with Arts Organizations  Funding

slide-6
SLIDE 6

Survey Demographics

slide-7
SLIDE 7

Findings

 33% of elementary students are getting an

average of less than one hour of arts instruction per week

 47% of schools offer instruction in only of the

four primary arts disciplines

8% of elementary schools and 4% of secondary schools provide formal arts instruction in all four arts disciplines

34% of 8th graders attend a school where there is no instruction in visual arts

slide-8
SLIDE 8

Findings

 63% of principals are dissatisfied with the

quantity of arts education in their schools

 42% of principals say statewide testing gets in

the way of meeting arts learning goals

 9% of schools offer no formal arts instruction

slide-9
SLIDE 9

Availability of Arts Education

 Decrease in K-6

hours since 2005

 Focus on state

testing a possible influence

slide-10
SLIDE 10

Arts Curricula

 Disciplines and grade levels with written

curriculum

 At best: 40% for upper elem. music

slide-11
SLIDE 11

Arts Assessments

Since 2005, significant change in assessment practice:

slide-12
SLIDE 12

The Middle School Challenge

 WA is below the

national average of numbers of 8th graders taught by FT arts specialists

 Most districts in WA

do not require any arts credits at the middle school level

slide-13
SLIDE 13

Staffing

 Arts teachers account for an

average of 6% of school’s teaching staff

 Average FTEs:

 Music = 1.16  Visual Arts = .71  Theatre = .12  Dance = .05

slide-14
SLIDE 14

Funding

District funds are most common and most important, but limited; many other funding sources are required.

slide-15
SLIDE 15

Markers of Quality & Action Agenda

 Elements of Effective,

Sustainable Practice

 Examples of Best

Practices

 Yard Stick  Practical options for

moving forward

 Best next steps vary

from district to district

 Everyone can play a

role

slide-16
SLIDE 16

From Research to Action

 What’s going on

locally?

 Catalyst for

conversation

 Work needs to be done

at all levels

slide-17
SLIDE 17

Key Arts Education Partner

www.artsedwashington.org A nonprofit organization devoted specifically and exclusively to advancing and increasing arts education in K-12 schools.

slide-18
SLIDE 18

More Information:

www.arts.wa.gov/education/aeri.shtml

Lisa Jaret

Arts in Education Program Manager Washington State Arts Commission

lisa.jaret@arts.wa.gov