estimation of peel stress at the overlap end of single
play

ESTIMATION OF PEEL STRESS AT THE OVERLAP END OF SINGLE-LAP JOINT BY - PDF document

18 TH INTERNATIONAL CONFERENCE ON COMPOSITE MATERIALS ESTIMATION OF PEEL STRESS AT THE OVERLAP END OF SINGLE-LAP JOINT BY USING EMBEDDED FBG H. Murayama 1* , K. Kageyama 1 , K. Uzawa 1 , I. Ohsawa 1 , K. Ohara 1 , H. Igawa 2 1 School of


  1. 18 TH INTERNATIONAL CONFERENCE ON COMPOSITE MATERIALS ESTIMATION OF PEEL STRESS AT THE OVERLAP END OF SINGLE-LAP JOINT BY USING EMBEDDED FBG H. Murayama 1* , K. Kageyama 1 , K. Uzawa 1 , I. Ohsawa 1 , K. Ohara 1 , H. Igawa 2 1 School of Engineering, the University of Tokyo, 7-3-1 Hongo, Bunkyo-ku, Tokyo 113-8656, Japan, 2 Japan Aerospace Exploration Agency, 6-3-1 Osawa, Mitaka-shi, Tokyo 181-0015, Japan * Corresponding author (murayama@sys.t.u-tokyo.ac.jp) Keywords : Bonded joint, Single-lap joint, Peel stress, FBG, OFDR, Distributed sensing 1 Introduction along the FBG when the specimen was subjected to The use of adhesive bonding in composites is the tensile loads. In this test, we also found that the recently increasing because it has advantages over reflected spectrums around the overlap end of the mechanically fastened joints. Therefore, single-lap joint were split, because there were large understanding the behavior of the adhesive joint is peel stresses which could cause the birefringence required for improving the reliability of a structure effect. In this paper, we propose the method to with bonding joints. identify the magnitude of the peel stress by Analytical and numerical approaches to determine analyzing the reflected spectrums split due to the stress or strain distributions inside the adhesive and birefringence effect. at the interfaces between the adhesive and the adherents have been proposed by many researchers [1-3]. On the other hand, although strain of the 2 Sensing System with OFDR surface on the adherents could be measured and 2.1 FBG Sensor compared with analytical results, it is difficult to FBG is an intrinsic devise with periodic perturbation measure strain inside the adhesive and at the of refractive index in the core of an optical fiber [6]. interfaces by conventional sensors, such as strain 
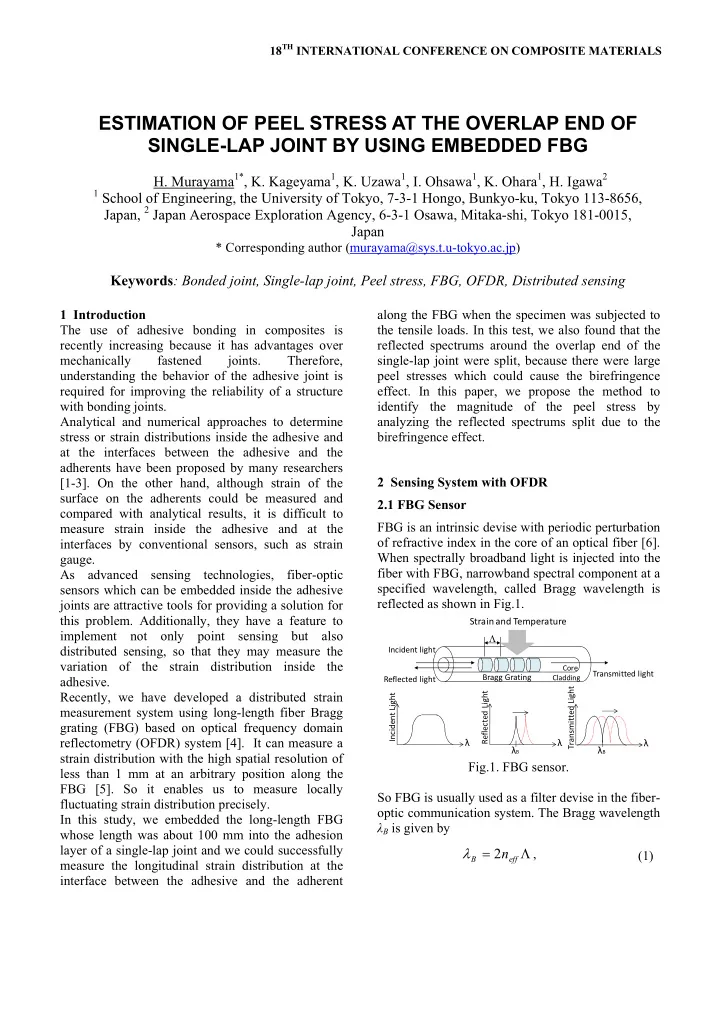
When spectrally broadband light is injected into the gauge. fiber with FBG, narrowband spectral component at a As advanced sensing technologies, fiber-optic specified wavelength, called Bragg wavelength is sensors which can be embedded inside the adhesive reflected as shown in Fig.1. joints are attractive tools for providing a solution for this problem. Additionally, they have a feature to Strain and Temperature implement not only point sensing but also  distributed sensing, so that they may measure the Incident light variation of the strain distribution inside the Core Transmitted light Bragg Grating adhesive. Cladding Reflected light Transmitted Light Recently, we have developed a distributed strain Reflected Light Incident Light measurement system using long-length fiber Bragg grating (FBG) based on optical frequency domain reflectometry (OFDR) system [4]. It can measure a λ λ λ λ B λ B strain distribution with the high spatial resolution of Fig.1. FBG sensor. less than 1 mm at an arbitrary position along the FBG [5]. So it enables us to measure locally So FBG is usually used as a filter devise in the fiber- fluctuating strain distribution precisely. optic communication system. The Bragg wavelength In this study, we embedded the long-length FBG λ B is given by whose length was about 100 mm into the adhesion layer of a single-lap joint and we could successfully    2 n , (1) B eff measure the longitudinal strain distribution at the interface between the adhesive and the adherent

  2. where Λ is the pitch of the grating, and n eff is the is shown in Fig.3. The signal D 2 is depending on the effective index of refraction of the core. When the intensity of the reflected light including oscillating pitch of FBG is mechanically changed by the components with frequencies corresponding to the applied strain, we can observe the wavelength shift path difference L i . in the reflected spectrum proportional to the change of the pitch. Therefore we can use FBG as a strain sensor, and strain of a structural member or inside a composite can be measured by monitoring the reflected light of FBG bonded on the surface or embedded into the laminate. Power Power 2.2 Sensing System Based on OFDR The sensing system of this study consists of a wavelength tunable laser, photodiode detectors (D1, D2), broadband reflectors (R1, R2, R3), 3 dB couplers (C1, C2, C3), a long-length FBG whose Wavelength(nm) Wavelength(nm) length is about 100 mm and a computer with an A/D Fig.3. Waveform of singal D 2 . converter. The arrangement of the system is shown Then by applying Fourier transform analysis with a in Fig.2. This arrangement is similar to that of Ref. [7]. When an incident light swept for a prescribed sliding window to the signal, we can separate the reflected spectra from each grating in the FBG as a span of wavelength is injected into the system, the spectrogram as shown in Fig.4. The horizontal axis light is split by the couplers and reflected by the reflectors and the FBG. represents wavelength of spectra, the vertical represents position and the color contrast represents the power of the spectra. In this spectrogram, we can see uniform reflection spectra along the FBG (1.00 m to 1.10 m). By determining the center wavelength of the spectra at each position in the spectrogram, we can map the strain profile along the long gauge FBG. In this study, we determined the center wavelength by calculating the center of the full width at half maximum (FWHM) of spectrum at Fig.2. Sensing system with OFDR. each position in the spectrogram. By using the signal of D1 as an external clock for A/D converter, we can sample the signal of D2 with the constant wavenumber interval,  k =  / n eff L R . The signal of D2 is simply given by       D R k cos 2 nL k , (2) 2 i i i where R i ( k ) is the spectrum reflected by i -th grating in the FBG, L i is a path difference between reflector R3 and the i -th grating. Thus the signal D 2 is represented as the summation of interference signals of reflected lights from the reflector R3 and from each grating in the FBG. The waveform of signal D 2 obtained from a FBG with the gauge length of 100 mm for uniform strain Fig.4. Spectrogram.

  3. PAPER TITLE 2.3 Birefringence effect In this case, the applied load can be estimated by As shown in Fig.5, non-axisymmetric strain is    P [N/mm] 27 . 5 [N/mm/nm] [nm] , (4) split applied to the optical fiber, and it can lead to birefringence effect. If birefringence effect occurs in where |  split | is the absolute difference between  Bx FBG sensor, it is well known that the reflected and  By . spectrum will be split [8]. Therefore, in the end of the overlap, large loads applied diametrically might make such a reflected spectrum splitting because of 3 Experiments the birefringence effect. 3.1 Specimen and Sensor Arrangement y Dimensions of the test specimen and the location of P the FBG sensor are shown in Fig.6. The specimen is a single-lap joint of two aluminum plates adhered by epoxy adhesive. A long-length FBG sensor whose length and diameter were 90 mm and about 150  m, respectively, was set on the V-shaped groove -a a machined on the aluminum plate and bonded by the x same epoxy as the adhesive. The grating of the Optical Fiber region A (40 mm) was bonded on the left adherent to measure the strain distribution of the left adherent which was outside the adhered section. The region B (30 mm) was embedded inside the adhered section P of the joint to measure strain distribution at the interface between the adhesive and the adherend. Fig.5. Optical fiber applied non-axisymmetric strain. The region C (20 mm) was kept free to be used as reference part for temperature compensation. Stresses of the fiber core can be determined by Airy stress function, they are given by P 3 P      core core , . (3) x y   a a In the case of plane strain condition, the relationship between the diametric load, P , and the wavelengths of the slow and fast modes,  Bx and  By , is shown in Fig.6. Fig.6. Dimensions of specimen and sensor location. 3.2 Split of Reflected Spectrum Figure 7 shows the reflected spectrums near the overlap end of the single-lap joint at the load of 0 N and 1570 N. We can see that the reflected spectrum is split in 1570 N. From the calculated results using finite element analysis, we can find large peeling stress is applied to the both end of the overlap, especially the left end in the region B. In such a case, birefringence effect occurs in FBG sensor, and it is well known that the reflected spectrum will be split. Therefore, in the end of the overlap, large loads applied diametrically might make such a reflected Fig.6. Wavelength shifts of the peaks 3

Download Presentation
Download Policy: The content available on the website is offered to you 'AS IS' for your personal information and use only. It cannot be commercialized, licensed, or distributed on other websites without prior consent from the author. To download a presentation, simply click this link. If you encounter any difficulties during the download process, it's possible that the publisher has removed the file from their server.

Recommend


More recommend