SLIDE 15 Corrected network measures
Introduction Overlap weight Corrected
Clustering coefficient Corrected clustering coefficient Conclusions References
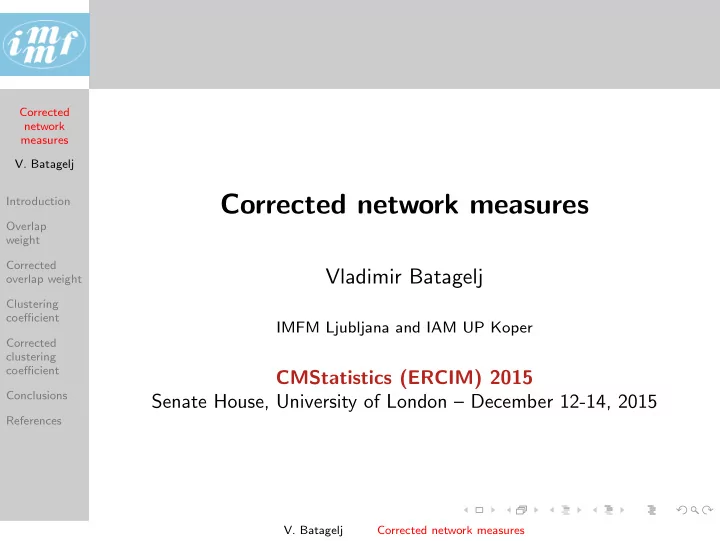
US Airports links
- ′( WB Hartsfield Atlanta, Charlotte/Douglas Intl ) = 0.7308
S e a t t l e
a c
a I n t l P
t l a n d I n t l M i n n e a p
i s
t P a u l I n t l / W
d
r e a t e r R
h e s t e r I n t l S y r a c u s e H a n c
k I n t l G e n e r a l M i t c h e l l I n t l l G r e a t e r B u f f a l
n t l A l b a n y C
n t y G e n e r a l E d w a r d L a w r e n c e L
a n D e t r
t M e t r
i t a n W a y n e C
C h i c a g
’ h a r e I n t l B r a d l e y I n t l C h i c a g
i d w a y T h e
e F r a n c i s G r e e n S t a t e T
e d
x p r e s s S t e w a r t I n t ’ l C l e v e l a n d
k i n s I n t l W i l k e s
a r r e / S c r a n t
I n t l E p p l e y A i r f i e l d F
t W a y n e I n t l l A k r
a n t
R e g i
a l L
g I s l a n d M a c A r t h u r S a l t L a k e C i t y I n t l L a G u a r d i a N e w a r k I n t l L e h i g h V a l l e y I n t l l J
n F K e n n e d y I n t l P i t t s b u r g h I n t l l H a r r i s b u r g I n t l l P
t C
u m b u s I n t l J a m e s M C
D a y t
I n t l P h i l a d e l p h i a I n t l S t a p l e t
I n t l I n d i a n a p
i s I n t l K a n s a s C i t y I n t l B a l t i m
e
a s h i n g t
I n t l C i n c i n n a t i / N
t h e r n K e n t u c k y I W a s h i n g t
D u l l e s I n t l W a s h i n g t
N a t i
a l L a m b e r t
t L
i s I n t l G u n n i s
C
n t y Y e a g e r L
i s v i l l e I n t l C h a r l
t e s v i l l e
l b e m a r l e B l u e G r a s s S a n F r a n c i s c
n t l R i c h m
d I n t l l R
n
e R e g i
a l / W
r u m F i e l d N
f
k I n t l T r i
i t i e s R e g i
a l T n / V a T u l s a I n t l N a s h v i l l e I n t l l P i e d m
t T r i a d I n t l l M c C a r r a n I n t l R a l e i g h
u r h a m I n t l l M c G h e e T y s
A s h e v i l l e R e g i
a l W i l l R
e r s W
l d K i n s t
R e g i
a l J e t p
t A t S t C h a r l
t e / D
g l a s I n t l M e m p h i s I n t l A l b u q u e r q u e I n t l L
e l l F i e l d F a y e t t e v i l l e R e g i
a l / G r a n n i s G r e e n v i l l e
p a r t a n b u r g A l b e r t J E l l i s A d a m s F i e l d H u n t s v i l l e I n t l
a r l T J
e s F N e w H a n
e r I n t l l O n t a r i
n t l L
A n g e l e s I n t l C
u m b i a M e t r
i t a n M y r t l e B e a c h I n t l J
n W a y n e A i r p
t
r a n g e C
n T h e W i l l i a m B H a r t s f i e l d A t l a n B i r m i n g h a m I n t l P h
n i x S k y H a r b
I n t l B u s h F i e l d C h a r l e s t
A f b / I n t l D a l l a s / F
t W
t h I n t l S a n D i e g
n t l
i n d b e r g h F l d C
u m b u s M e t r
i t a n M
r
R e g i
a l S h r e v e p
t R e g i
a l J a c k s
I n t l l D a n n e l l y F i e l d S a v a n n a h I n t l l E l P a s
n t l M
i l e R e g i
a l B a t
R
g e M e t r
i t a n , R y a n J a c k s
v i l l e I n t l P e n s a c
a R e g i
a l T a l l a h a s s e e R e g i
a l R
e r t M u e l l e r M u n i P a n a m a C i t y
a y C
n t l N e w O r l e a n s I n t l / M
s a n t F l d / H
s t
I n t e r c
t i n e n t a l G a i n e s v i l l e R e g i
a l W i l l i a m P H
b y S a n A n t
i
n t l D a y t
a B e a c h I n t l O r l a n d
n t l M e l b
r n e I n t l l T a m p a I n t l S a r a s
a / B r a d e n t
I n t l P a l m B e a c h I n t l S
t h w e s t F l
i d a I n t l F
t L a u d e r d a l e / H
l y w
I n t l M i a m i I n t l H
u l u I n t l L u i s M u n
M a r i n I n t l C y r i l E K i n g
Corrected network measures