Estimated Bills Outstanding - Summary $ in millions February - - PDF document

estimated bills outstanding summary
SMART_READER_LITE
LIVE PREVIEW

Estimated Bills Outstanding - Summary $ in millions February - - PDF document

Governor's Office of Management and Budget Estimated Bills Outstanding - Summary $ in millions February February 2019 2020 Bills at Comptroller Higher Education $ 720 $ 728 Education (Elementary, Secondary) 959 1,009 Health Care


slide-1
SLIDE 1

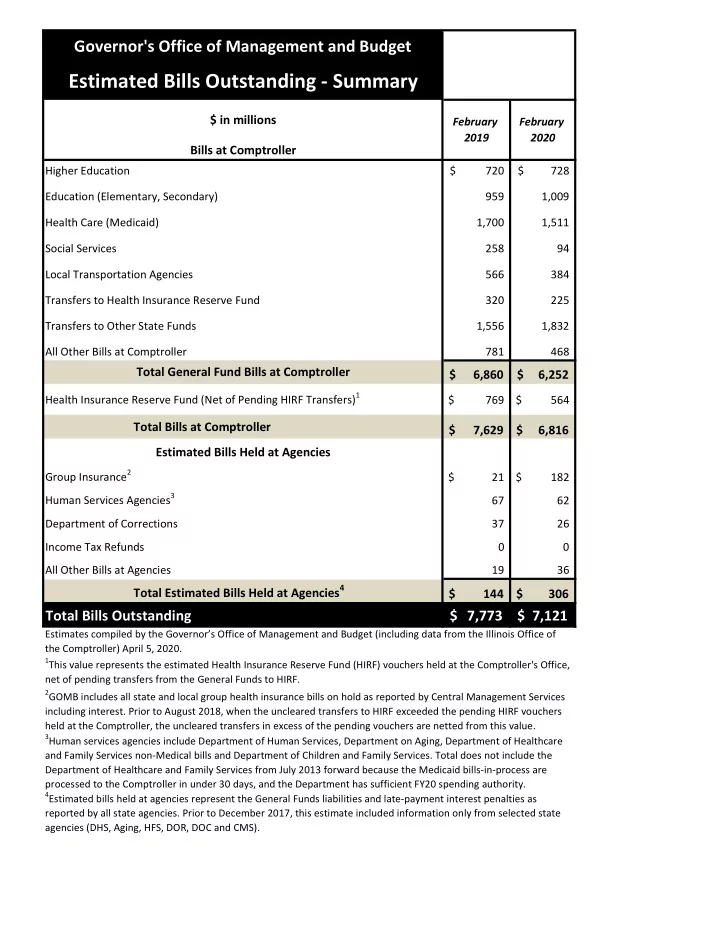
Higher Education 720 $ 728 $ Education (Elementary, Secondary) 959 1,009 Health Care (Medicaid) 1,700 1,511 Social Services 258 94 Local Transportation Agencies 566 384 Transfers to Health Insurance Reserve Fund 320 225 Transfers to Other State Funds 1,556 1,832 All Other Bills at Comptroller 781 468

6,860 $ 6,252 $

Health Insurance Reserve Fund (Net of Pending HIRF Transfers)1 769 $ 564 $

Total Bills at Comptroller 7,629 $ 6,816 $

Group Insurance2 21 $ 182 $ Human Services Agencies3 67 62 Department of Corrections 37 26 Income Tax Refunds 0 0 All Other Bills at Agencies 19 36

Total Estimated Bills Held at Agencies4 144 $ 306 $

Total Bills Outstanding 7,773 $ 7,121 $

February 2019

Estimated Bills Held at Agencies Total General Fund Bills at Comptroller Bills at Comptroller $ in millions

February 2020

Estimates compiled by the Governor’s Office of Management and Budget (including data from the Illinois Office of the Comptroller) April 5, 2020.

1This value represents the estimated Health Insurance Reserve Fund (HIRF) vouchers held at the Comptroller's Office,

net of pending transfers from the General Funds to HIRF.

2GOMB includes all state and local group health insurance bills on hold as reported by Central Management Services

including interest. Prior to August 2018, when the uncleared transfers to HIRF exceeded the pending HIRF vouchers held at the Comptroller, the uncleared transfers in excess of the pending vouchers are netted from this value.

3Human services agencies include Department of Human Services, Department on Aging, Department of Healthcare

and Family Services non-Medical bills and Department of Children and Family Services. Total does not include the Department of Healthcare and Family Services from July 2013 forward because the Medicaid bills-in-process are processed to the Comptroller in under 30 days, and the Department has sufficient FY20 spending authority.

4Estimated bills held at agencies represent the General Funds liabilities and late-payment interest penalties as

reported by all state agencies. Prior to December 2017, this estimate included information only from selected state agencies (DHS, Aging, HFS, DOR, DOC and CMS).

Estimated Bills Outstanding - Summary

Governor's Office of Management and Budget

slide-2
SLIDE 2

3,491 4,772 5,557 5,875 6,176 6,621 6,278 6,563 6,306 5,516 6,406 8,076 7,582 7,958 9,123 9,452 10,744 11,427 11,497 13,088 13,932 12,853 14,607 15,233 14,805 15,446 15,809 17,176 9,147 9,145 8,821 8,555 8,391 7,297 7,686 6,719 7,503 7,531 7,551 7,179 7,329 7,147 7,272 7,773 7,886 6,203 6,644 6,774 6,432 6,811 6,212 6,764 6,277 6,863 6,686 7,121

$- 2,000 4,000 6,000 8,000 10,000 12,000 14,000 16,000 18,000 20,000

July 2015

  • Aug. 2015
  • Sept. 2015
  • Oct. 2015
  • Nov. 2015
  • Dec. 2015
  • Jan. 2016
  • Feb. 2016

March 2016 April 2016 May 2016 June 2016 July 2016

  • Aug. 2016
  • Sept. 2016
  • Oct. 2016
  • Nov. 2016
  • Dec. 2016
  • Jan. 2017
  • Feb. 2017
  • Mar. 2017
  • Apr. 2017

May 2017 June 2017 July 2017

  • Aug. 2017
  • Sept. 2017
  • Oct. 2017
  • Nov. 2017
  • Dec. 2017
  • Jan. 2018
  • Feb. 2018
  • Mar. 2018
  • Apr. 2018

May 2018 June 2018 July 2018

  • Aug. 2018
  • Sept. 2018
  • Oct. 2018
  • Nov. 2018
  • Dec. 2018
  • Jan. 2019
  • Feb. 2019
  • Mar. 2019
  • Apr. 2019

May 2019 June 2019 July 2019

  • Aug. 2019
  • Sept. 2019
  • Oct. 2019
  • Nov. 2019
  • Dec. 2019
  • Jan. 2020
  • Feb. 2020

$ in millions

Governor's Office of Management and Budget Estimated Bills Backlog Total

July 2015 through February 2020

Estimates compiled by the Governor’s Office of Management and Budget (including data from the Illinois Office of the Comptroller). Prior to December 2017, this estimate included only selected state agencies (DHS, Aging, HFS, DOR, DOC and CMS). Prior to June 2016, this estimate did not include all bills at Department of Human Services, or any bills held at Department of Corrections or Department on Aging. Prior to March 2018, this estimate did not include pending vouchers payable from the Health Insurance Reserve Fund.

slide-3
SLIDE 3

Higher Education 720 $ 596 $ 259 $ 184 $ 31 $ 90 $ 221 $ 402 $ 689 $ 715 $ 639 $ 646 $ 728 $ Education (Elementary, Secondary) 959 1,209 909 705 829 848 802 873 1,020 995 1,024 1,020 1,009 Health Care (Medicaid) 1,700 1,703 1,187 1,751 993 820 1,187 773 836 603 940 913 1,511 Social Services 258 287 200 289 562 607 581 238 119 148 216 108 94 Local Transportation Agencies 566 566 417 417 387 387 384 384 384 384 384 384 384 Transfers to Health Insurance Reserve Fund 320 340 250 370 381 370 394 114 180 245 195 225 225 Transfers to Other State Funds 1,556 1,485 1,529 1,552 1,642 1,634 1,639 1,749 1,871 1,782 1,931 2,001 1,832 All Other Bills at Comptroller 781 668 345 248 336 442 401 531 548 407 488 448 468

6,860 $ 6,855 $ 5,096 $ 5,515 $ 5,161 $ 5,198 $ 5,611 $ 5,064 $ 5,647 $ 5,279 $ 5,815 $ 5,745 $ 6,252 $

Health Insurance Reserve Fund (Net of Pending HIRF Transfers)1 769 732 776 797 1,259 759 752 758 788 692 755 617 564

7,629 $ 7,587 $ 5,871 $ 6,312 $ 6,421 $ 5,957 $ 6,364 $ 5,822 $ 6,435 $ 5,970 $ 6,570 $ 6,362 $ 6,816 $

Group Insurance2 21 $ 156 $ 182 $ 164 $ 175 $ 167 $ 180 $ 214 $ 207 $ 201 $ 199 $ 180 $ 182 $ Human Services Agencies3 67 71 58 55 38 107 91 75 52 61 63 70 62 Department of Corrections 37 47 68 91 115 125 113 73 51 24 8 44 26 Income Tax Refunds All Other Bills at Agencies 19 24 24 23 26 76 64 29 19 20 23 31 36

144 $ 299 $ 332 $ 332 $ 354 $ 475 $ 447 $ 391 $ 329 $ 307 $ 293 $ 324 $ 306 $

Total Bills Outstanding 7,773 $ 7,886 $ 6,203 $ 6,644 $ 6,774 $ 6,432 $ 6,811 $ 6,212 $ 6,764 $ 6,277 $ 6,863 $ 6,686 $ 7,121 $

Dec 2019 Oct 2019 Sept 2019 Aug 2019

Fiscal Year 2019

Nov 2019 April 2019 May 2019 June 2019 July 2019

$ in millions Bills at Comptroller

Estimated Bills Outstanding

Governor's Office of Management and Budget

Total Estimated Bills Held at Agencies4 Estimated Bills Held at Agencies

Jan 2020 Mar 2019 Feb 2020

Fiscal Year 2020

1This value represents the estimated Health Insurance Reserve Fund (HIRF) vouchers held at the Comptroller's Office, net of pending transfers from the General Funds to HIRF. 2GOMB includes all state and local group health insurance bills on hold as reported by Central Management Services including interest. Prior to August 2018, when the uncleared transfers to HIRF exceeded the pending HIRF vouchers held at the Comptroller, the

uncleared transfers in excess of the pending vouchers are netted from this value.

3Human services agencies include Department of Human Services, Department on Aging, Department of Healthcare and Family Services non-Medical bills and Department of Children and Family Services. Total does not include the Department of Healthcare and

Family Services from July 2013 forward because the Medicaid bills-in-process are processed to the Comptroller in under 30 days, and the Department has sufficient FY20 spending authority.

4Estimated bills held at agencies represent the General Funds liabilities and late-payment interest penalties as reported by all state agencies. Prior to December 2017, this estimate included information only from selected state agencies (DHS, Aging, HFS, DOR,

DOC and CMS).

Total Bills at Comptroller Total General Fund Bills at Comptroller

Feb 2019