
1
1
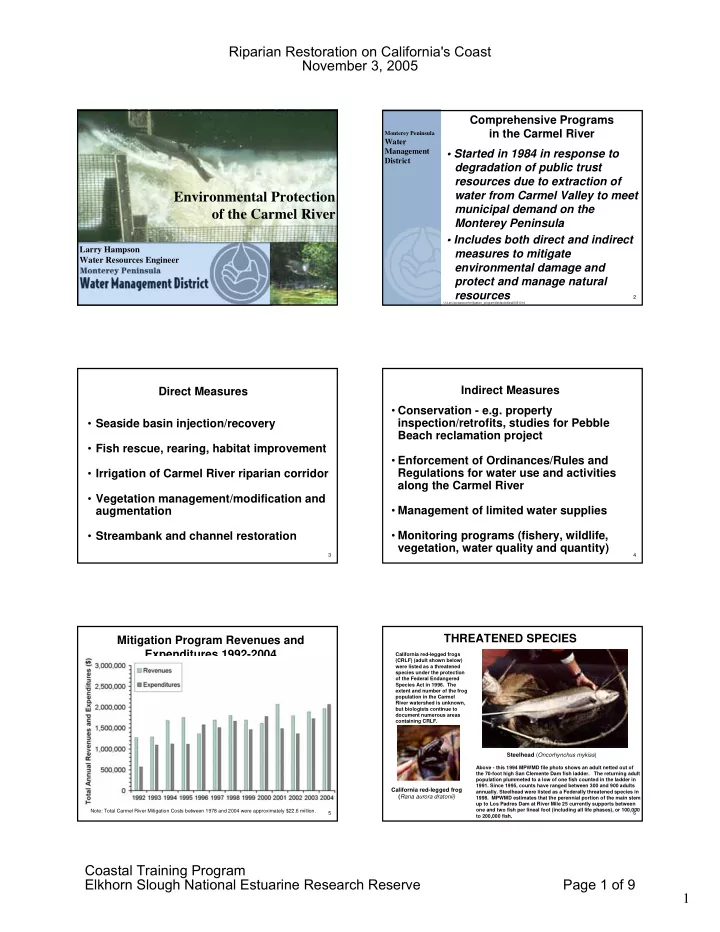
Environmental Protection
- f the Carmel River
Larry Hampson Water Resources Engineer
2
Comprehensive Programs in the Carmel River
- Started in 1984 in response to
degradation of public trust resources due to extraction of water from Carmel Valley to meet municipal demand on the Monterey Peninsula
- Includes both direct and indirect
measures to mitigate environmental damage and protect and manage natural resources
Monterey Peninsula
Water Management District
U:\Larry\powerpoint\mitigation_program\fieldactivities20051014
3
Direct Measures
- Seaside basin injection/recovery
- Fish rescue, rearing, habitat improvement
- Irrigation of Carmel River riparian corridor
- Vegetation management/modification and
augmentation
- Streambank and channel restoration
4
Indirect Measures
- Conservation - e.g. property
inspection/retrofits, studies for Pebble Beach reclamation project
- Enforcement of Ordinances/Rules and
Regulations for water use and activities along the Carmel River
- Management of limited water supplies
- Monitoring programs (fishery, wildlife,
vegetation, water quality and quantity)
5
Mitigation Program Revenues and Expenditures 1992-2004
Note: Total Carmel River Mitigation Costs between 1978 and 2004 were approximately $22.6 million. 6
THREATENED SPECIES
California red-legged frog (Rana aurora dratonii)
California red-legged frogs (CRLF) (adult shown below) were listed as a threatened species under the protection
- f the Federal Endangered
Species Act in 1996. The extent and number of the frog population in the Carmel River watershed is unknown, but biologists continue to document numerous areas containing CRLF.
Steelhead (Oncorhynchus mykiss)
Above - this 1994 MPWMD file photo shows an adult netted out of the 70-foot high San Clemente Dam fish ladder. The returning adult population plummeted to a low of one fish counted in the ladder in
- 1991. Since 1995, counts have ranged between 300 and 900 adults
- annually. Steelhead were listed as a Federally threatened species in
- 1998. MPWMD estimates that the perennial portion of the main stem
up to Los Padres Dam at River Mile 25 currently supports between
- ne and two fish per lineal foot (including all life phases), or 100,000
to 200,000 fish.