ENTERTAINMENT FACILITY STUDY August 14, 2018 City Council Briefing - - PowerPoint PPT Presentation
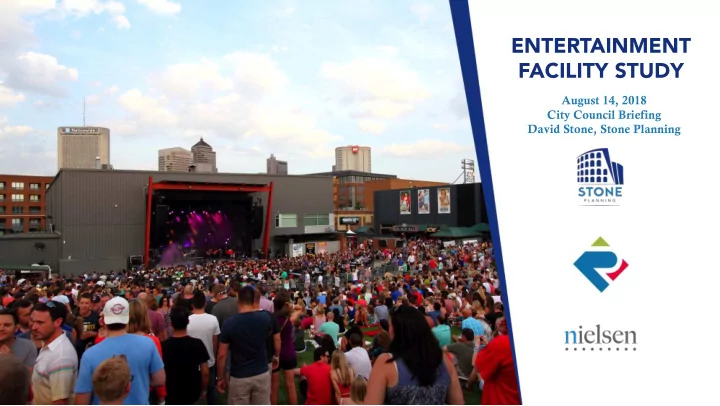
ENTERTAINMENT FACILITY STUDY August 14, 2018 City Council Briefing David Stone, Stone Pla n ning LIVE MUSIC/ ENTERTAINMENT INDUSTRY TRENDS 2 LIVE MUSIC/ ENTERTAINMENT INDUSTRY TRENDS THE TOURING EVENTS INDUSTRY The live entertainment
LIVE MUSIC/ ENTERTAINMENT INDUSTRY TRENDS
2
LIVE MUSIC/ ENTERTAINMENT INDUSTRY TRENDS
THE TOURING EVENTS INDUSTRY
- The live entertainment industry is thriving – music, sports, comedy, speakers, and other forms of entertainment
- For music in particular, technology has increased the importance of live performances to artists:
- Loss of revenue from physical sales
- Number of concerts has increased dramatically
- Increasing ticket prices and ticket sales
- Top 200 tours:
- 36% average 5,000 or fewer attendees
- 18% average 5,000 to 7,500 attendees
- Consolidation of promoters:
- Live Nation sells 40%+ of worldwide tickets
- AEG 12%, all others 46%
3
LIVE MUSIC/ ENTERTAINMENT INDUSTRY TRENDS
COMPARABLE FACILITIES
- The indoor/outdoor model is becoming more popular, particularly within broader mixed-use/entertainment developments
- Facilities analyzed:
Columbus, OH Columbus Arena District
5,200 outdoor / 2,200 indoor
Adjacent venues: 300 and 400 seats Performance:
Indoor/Outdoor: ~85 events, 2,100 avg. atten, $33 avg. ticket price The Basement: 85 events, 200 avg. atten., $14
- avg. ticket price
A&R Music Lounge: 67 events, 290 avg. atten., $16 avg. ticket price
Pittsburgh, PA North Shore
5,000 outdoor / 2,300 indoor
Other indoor capacities: 400, 450,
and 1,500
Performance:
Indoor/Outdoor: 100 events (70 indoor/30
- utdoor), 1,800 avg. atten, $33 avg. ticket price
The Club: ~15 events, 270 avg. atten., $18 avg. ticket price 55 private events
Irving, TX Toyota Music Factory
8,000 outdoor / 2,500 and 4,000
indoor Performance:
First 8 Months: 59 events, 3,400 avg. atten, $55
- avg. ticket price
4
FEASIBILITY AND ECONOMIC IMPACT STUDY SUMMARY
5
THE LOCAL MARKET
- Virginia Beach has 450,000+ residents, and the Designated Market
Area has 1.5 million residents
- The area is a major tourist market – 19 million “person trips” in 2017
- Characteristics of the DMA market compared to the US:
- Demographics:
- Young – lower average age
- Affluent – higher household income
- Educated – higher percent of post-high school
educations
- Employed – higher percent of full-time employees
- Activities:
- More likely to attend concerts (rock, country, and hip-
hop/rap)
- More likely to attend comedy clubs
FEASIBILITY AND ECONOMIC IMPACT STUDY SUMMARY
6
THE LOCAL/REGIONAL ENTERTAINMENT MARKET
- Multiple indoor and outdoor facilities host ticketed and free events in the area
- Indoor facilities:
- The need for a 2,500-to-3,500-seat venue at the beachfront was identified in 2002
- A new facility would compete somewhat with the Chrysler Hall and The NorVa, and to a lesser extent, the Sandler Center
- Outdoor facilities:
- A new facility would compete somewhat with Union Bank & Trust Pavilion, and to a lesser extent, Veterans United Home Loans
Amphitheater
- Free programming: there is a significant amount of free event offerings in the market, but the new venue is expected to complement
current offerings and work with the City to provide more
FEASIBILITY AND ECONOMIC IMPACT STUDY SUMMARY
7
CONCLUSIONS AND RECOMMENDATIONS
- Virginia Beach/Hampton Roads is a strong and attractive market
- Demand for live entertainment is increasing
- The Event Center is sized to attract more than half of touring events
- There has long been an identified need for a new indoor entertainment venue at the beachfront
- Competition with existing venues (particularly within Virginia Beach) will be minimal
- Market feasibility for 3,200-seat indoor venue and 5,000-seat outdoor venue
- Flexibility with capacities and configurations
- OVG’s involvement
- Routing for touring events
- Open booking policy
- Built-in sound and light
- Ability to host free and ticketed events outdoors
FEASIBILITY AND ECONOMIC IMPACT STUDY SUMMARY
8
OPERATING AND ECONOMIC IMPACT FORECASTS
FEASIBILITY AND ECONOMIC IMPACT STUDY SUMMARY
PR PROJECTE TED EVENTS TS AND ATTE TTENDANCE
# # of Event ents Av
- Avg. At
Atten. To Total Atten. Concerts - Indoor Reserved 30 2,167 65,000 Concerts - Indoor GA 40 2,719 108,750 Concerts - Outdoor 20 3,600 72,000 Concerts - Minor 40 300 12,000 Other Ticketed Sports/Entertainment 5 2,250 11,250 Community Events 32 1,500 48,000 Private/Social Events 50 250 12,500 Festivals 3 3,000 9,000 Surf Park Events 3 500 1,500 TO TOTA TAL 223 223 340, 340,000 000
Source: Stone Planning
SU SUMMARY PRO FO FORMA ($000S) $000S)
Op Operating R Revenues Event Revenues $8,496 Non-Event Revenues 743 To Total Operating Revenues $9, $9,239 239 Op Operating E Expenses Event Expenses $6,641 Non-Event Expenses 1,497 To Total Operating Expenses $8, $8,138 138 Net Net Oper erating ng Inc ncome e (Loss) $1, $1,101 101
Source: Stone Planning
SUMMARY OF ECONOMIC/FISCAL L IMPACTS FROM OPERATIONS ($000s)
Op Operations ( (Annual) Total Spending - Direct and Indirect $18,249 Total Jobs (Full-Time Equivalent) 105 Total Earnings $4,398 Room Nights 20,970 New Tax Revenues to the City $232 Con Construct ction
- n (One-Time)
Labor Expenditures $18,255 Sales of Materials $7,947 Employment 314 New Tax Revenues to the City $201
Source: Stone Planning
9