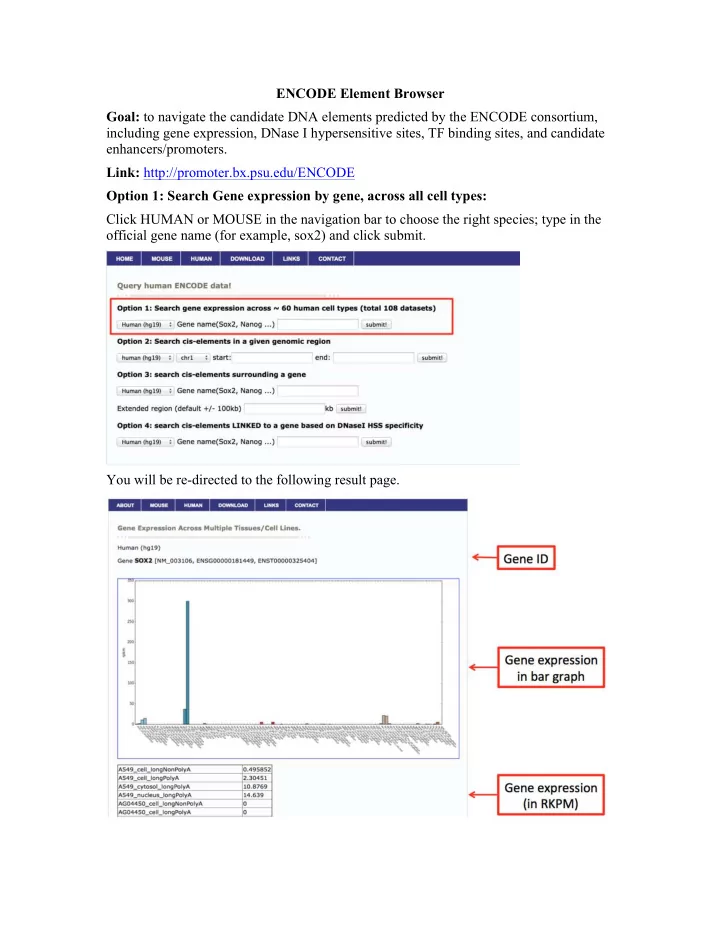
SLIDE 1 ENCODE Element Browser Goal: to navigate the candidate DNA elements predicted by the ENCODE consortium, including gene expression, DNase I hypersensitive sites, TF binding sites, and candidate enhancers/promoters. Link: http://promoter.bx.psu.edu/ENCODE Option 1: Search Gene expression by gene, across all cell types: Click HUMAN or MOUSE in the navigation bar to choose the right species; type in the
- fficial gene name (for example, sox2) and click submit.
You will be re-directed to the following result page.
SLIDE 2
In the upper panel of the result page, we plotted gene expression in a bar graph that you can directly use in your publication. In the table below the bar graph, we listed the RPKM values across all the tissue/cell types for the queried gene. Option 2: Search cis-elements in a given genomic region: Under option 2, first choose chromosome from the dropdown menu and then type in the start and the end position (for example, chr3, 181000000, 182000000); click submit. First, we can see the experimentally determined DNase I Hypersensitive sites (DHS). The first column is the coordinates of DHS and the second column lists the tissue/cell type where the DHS is present. Note: at this time, the queried DHS sites only include 14 cell types where we have both DHS and H3K27ac ChIP-Seq data: GM12878, H1-hESC, HeLa-S3, HepG2, HMEC, HSMM, HSMMtube, HUVEC, K562, NH-A, NHDF-Ad, NHEK, NHLF, Osteobl. The list will be expanded soon to incorporate more cell types. For more information, please visit: https://www.encodeproject.org/data/annotations/
SLIDE 3
Scrolling down in the same page, we also listed the TF binding sites in this region. This table has three columns. The first column lists the coordinates of the TF binding sites. The second column list the transcription factor and the third column list in which tissue/cell types the TF binding sites are located. Option 3: Search cis-elements surrounding a gene: This option is similar to option 2, but it searches by gene names rather than a given genomic locus. Therefore, the users can conveniently type in the gene name of interest and specify the extended region around the gene TSS. The DHS sites and TF binding sites will be displayed in a similar pattern as in option 2. For example, please type in sox2 and 20 kb for the extended region.
SLIDE 4 Option 4: Search cis-elements linked to a gene based on DHS: This option will help users predict the linkage between distal regulatory elements with their target genes. The prediction is based the tissue specificity of DHS across 129 cell
- types. Users can type in the gene name under option 4 and then click submit (sox2).
Below is the result: Columns 1-3 are the loci for the proximal DHS near the queried gene. Column 4 is the gene name. Columns 5-7 are the distal DHS that are associated with the queried gene. The last column is the Pearson correlation between the distal and proximal DHS (for more details, please refer to Thurman, et al, Science 2012) Data: All the human data used in this query website is from: https://www.encodeproject.org/data/annotations/. All the mouse data can be downloaded from: http://mouseencode.org.
SLIDE 5 3D genome browser Goal: To develop user-friendly browser to visualize Hi-C and Chia-PET data. Main features:
- 1. Easy navigation functions such as zooming in/out, moving to left/right.
- 2. The ability to incorporate customized UCSC genome browser session.
- 3. Gene centric view: allow users to predict linkage between enhancers and their
target genes, based on integrated views of Hi-C/ChIA-PET data and the linkage based on correlation of distal and proximal DHS sites.
- 4. Allow query human trait and disease-associate SNPs and find regions interact
with them through chromatin looping.
- 5. Use your own Hi-C data.
Link: http://3dgenome.org Generate Hi-C Interaction heatmap
- 1. Click "HI-C INTERACTIONS" tab;
- 2. Using dropdown menu to choose species and assembly.
- 3. Choose the source of Hi-C data:
Option 1. Use dropdown menu to choose the published Hi-C data;
SLIDE 6 Option 2. Specify the location of your own Hi-C data. Note: it needs to be converted to a binary file using our provided script.
- 4. Choose genomic region to show Hi-C interaction
Option 1: Search by Gene Name(RefSeq ID or Uniprot ID). By default, this regions will be ± 50 bins, with each bin size = matrix resolution; Option 2: Search by genomic locus. Example: 1) Choose human, hg19; 2) choose “Browse available Hi-C data”, GM12878, 25kb 3) type sox2 in the under Option 1 and click “show Interaction”. Below is the Hi-C interaction map around sox2 region. Navigate Hi-C data:
- 1. The "Move Left" and "Move Right" buttons allow users traversing the current
genomic regions in the upstream or downstream directions, respectively.
- 2. The "Zoom In" and "Zoom Out" buttons allow users zoom in or zoom out from
the current genomic region by three times. In order to not overload the server, we only support a maximum region of 1500 bins currently.
- 3. Adjusting color scale: The minimum and maximum intensity cutoff values are
important in determining the colors of Hi-C heatmaps. As the values inside the bins of the contact matrix reflect the number of interactions, any values below the minimum cutoff value would be shown as white and any values above the maximum cutoff value would be shown as red.
SLIDE 7 Download Image: To save the image, right click this link and select "Save Link As" (this might be different depending on the web browser). In the resulting dialog box, enter an appropriate name and click "Save" to save the heatmap as a jpeg. Use your own UCSC genome browser session Users can locate your UCSC genome browser session and copy and paste the session ID in the 3D genome browser, so that they can overlay the Hi-C data with other genomics/epigenomics data. The UCSC genome browser session ID is the string after “hgsid=”. User your own Hi-C data A useful feature for our 3D genome browser is that you can visualize your own Hi-C
- data. This feature is important to work with unpublished data, as only the users can know
and specify the location of their Hi-C data. However, users need to convert the standard Hi-C interaction matrix to binary format, using a script that we provide. Next, a user can put the binary Hi-C data in an internet accessible place and copy the link in our browser. Potential pitfall: Please make sure the genome assembly and bin size is set correctly.
SLIDE 8
Virtual 4C Rather than visualizing all the interactions in a given region, some users are more interested to see the chromatin interactions with one anchor point, for example, a gene
SLIDE 9 promoter region. This information might be useful to predict the enhancers that regulate their genes of interests. To address this request, we can extract a row of data from a Hi-C interaction matrix, centered at the queried gene, and plot it in the follow figure. This figure is termed “virtual 4C”, as the way the data is presented is the same as 4C (Circularized Chromosome Conformation Capture), but we use Hi-C instead. Example: In the above example, click virtual 4C, choose human, hg19 and type in
- BRC1. The vertical red line is the promoter of BRC1. Be default, we display +-500kb
around the anchor point. The value in y-axis is the interaction frequencies measured by Hi-C. For this feature, you can either use gene name or a SNP ID. Immediately below the virtual 4C track, the color bars indicate the distal DHS sites that are correlated to the proximal DHS near the queried gene. On the lower panel of the result page, we show the histone modification in the same cell type, which can be used to predict candidate enhancers. Therefore, by visualizing the virtual 4C, linkage by DHS and Epigenomics data generated by ENCODE, the query provide a powerful tool to predict the linkage between target genes and their distal regulatory elements.
SLIDE 10 ChromHMM tutorial This tutorial explain step by step how to setup and run ChromHMM on the provided example, or with pre-aligned ChIP-seq datasets in .bam format. Prerequisites for this tutorial
- Required:
- 1. Java virtual machine (http://java.com/)
- 2. ChromHMM software
(http://compbio.mit.edu/ChromHMM/ChromHMM.zip)
- Optionally, if you want to use it on your data:
- 1. Raw or aligned reads for different histone modifications for example from
the ENCODE portal (https://www.encodeproject.org/)
- 2. Bedtools (https://github.com/arq5x/bedtools2)
Installation 1) Open a terminal and check if you have java installed: myhost:~ luca$ java -showversion java version "1.6.0_65" Java(TM) SE Runtime Environment (build 1.6.0_65-b14-466.1-11M4716) Java HotSpot(TM) 64-Bit Server VM (build 20.65-b04-466.1, mixed mode) 2) Download the chromHMM .zip archive from here: http://compbio.mit.edu/ChromHMM/ChromHMM.zip and decompress it. Testing ChromHMM on the provided example 1) Open a terminal and go the decompressed folder, for example: cd ~/Downloads/ChromHMM 2) Run the provided example on Human data: java –mx4000M -jar ChromHMM.jar LearnModel SAMPLEDATA_HG18 OUTPUTSAMPLE 10 hg18 3) Open the output html page webpage_10.html, inside the newly created folder OUTPUTSAMPLE, with a modern browser (for example safari, chrome, firefox
- r internet explorer) and explore the output.
Visualize the segmentation
SLIDE 11 1) Launch IGV from the Broad website clicking the Launch button from this webpage: https://www.broadinstitute.org/software/igv/download 2) Select the Human Genome hg18 form the top left corner 3) Drag and drop the following .bed file created by the ChromHMM in the IGV main window:
- a. K562_10_dense.bed
- b. GM12878_10_dense.bed
SLIDE 12 Run ChromHMM starting from aligned files (.bam) To run ChromHMM starting from aligned .bam files, for different histone modifications, (for example downloaded from the ENCODE portal) some additional steps are required before running the LearnModel command showed in the previous example. 1) Let’s assume you have already downloaded/created some .bam files in the folder ~/data for different histone marks/cell types. 2) Using the bedtools for each .bam file you need to convert it to a .bed file with the following command: bedtools bamtobed -i cell1_mark1.bam > ~/data/cell1_mark1.bed 3) Create an empty file called cellmarkfiletable.txt in ~/data. Each row of this file should contain the following information: cell type (for example K562), the name
- f the mark (for example H3k4me1), the filename of the .bed file for that mark
and the optional input or control .bed. It should look similar to this: cell1 mark1 cell1_mark1.bed cell1_control.bed cell1 mark2 cell1_mark2.bed cell1_control.bed cell2 mark1 cell2_mark1.bed cell2_control.bed cell2 mark2 cell2_mark2.bed cell2_control.bed Note: you can put marks for different cell types in this file. In this way you will learn a model for all the cell types simultaneously. 4) Now we can binarize the tracks converted to .bed with this command: java –mx4000M –jar ChromHMM.jar BinarizeBed –b 200 CHROMSIZES/hg18 ~/data/ ~/data/cellmarkfiletable.txt ~/binarizedData 5) Finally we can learn the model and generate the output, as done before with the provided example, with this command: java –mx4000M -jar ChromHMM.jar LearnModel ~/binarizedData MYOUTPUT 10 hg18 Here we are assuming that the genome of reference is hg18, but other genomes are available. See the documentation for more details: http://compbio.mit.edu/ChromHMM/ChromHMM_manual.pdf
SLIDE 13 UCI SOMatic Browser Goal: to allow navigation of highly dimensional data sets by way of Self-Organizing Maps (SOMs) Link: http://crick.bio.uci.edu/SOMatic Tutorial Steps: Download the latest version: $ wget http://crick.bio.uci.edu/SOMatic/SOMatic_Latest.tgz Installing: Be sure that gcc version>2.8.2 is loaded by running: $ g++ --version Untar the SOMatic folder and go inside the bin directory: $ tar –zxf SOMatic_Latest.tgz $ cd SOMatic/bin Run make: $ make Building website: To test the program, go to SOMatic/scripts and run the following: $ ./buildsite.sh -SOMName ExampleWebsite -Matrix ../examples/example.matrix
- Rows 30 -Cols 50 -SampleList ../examples/sample.list -Timesteps 4000000 -
Trials 3 (Optional) Add gene overlay: Start in the SOMatic directory, download the gtf file from Ensembl, and unzip it: $ wget ftp://ftp.ensembl.org/pub/release- 80/gtf/mus_musculus/Mus_musculus.GRCm38.80.gtf.gz $ gzip –d Mus_musculus.GRCm38.80.gtf.gz Run the following in the SOMatic/scripts directory: $ ./getgenes.sh -SOMName ExampleWebsite -Rows 30 -Cols 50 -GTFFile ../Mus_musculus.GRCm38.80.gtf -AddToChrom chr (Optional) Add GO overlay: Start in the SOMatic directory, download the gene2go and gene_info files from ncbi, and unzip them: $ wget ftp://ftp.ncbi.nih.gov/gene/DATA/gene2go.gz $ gzip –d gene2go.gz $ wget ftp://ftp.ncbi.nih.gov/gene/DATA/GENE_INFO/ Mammalia/Mus_musculus.gene_info.gz $ gzip –d Mus_musculus.gene_info.gz $ wget http://geneontology.org/ontology/go.obo
SLIDE 14
Run the following in the SOMatic/scripts directory: $ ./getGOGenomic.sh -SOMName ExampleWebsite -Rows 30 -Cols 50 - Gene2GO ../gene2go -GeneInfo ../Mus_musculus.gene_info -GOFile ../go.obo