emras ii wg 4 wetland scenario instructions
play

EMRAS II WG 4: Wetland Scenario Instructions (Utnora swamp, Sweden) - PDF document

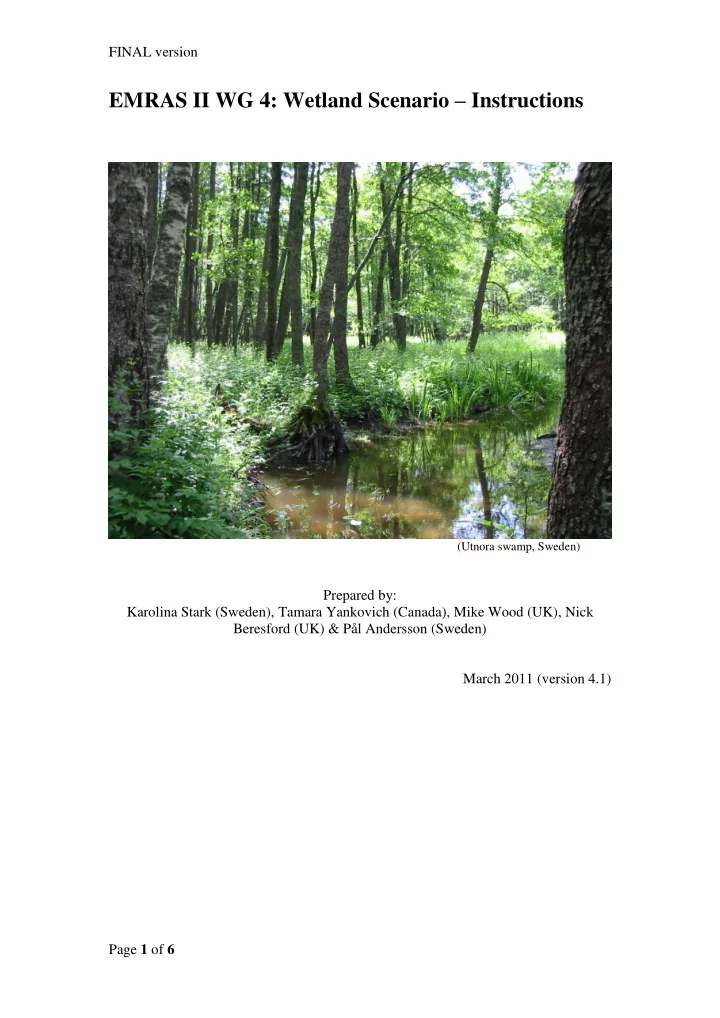
FINAL version EMRAS II WG 4: Wetland Scenario Instructions (Utnora swamp, Sweden) Prepared by: Karolina Stark (Sweden), Tamara Yankovich (Canada), Mike Wood (UK), Nick Beresford (UK) & Pl Andersson (Sweden) March 2011 (version 4.1)


  1. FINAL version EMRAS II WG 4: Wetland Scenario – Instructions (Utnora swamp, Sweden) Prepared by: Karolina Stark (Sweden), Tamara Yankovich (Canada), Mike Wood (UK), Nick Beresford (UK) & Pål Andersson (Sweden) March 2011 (version 4.1) Page 1 of 6

  2. FINAL version 1. Introduction The objective of this exercise is to investigate how current models for wildlife dose assessments can be applied to contaminated wetland areas. Many models consider terrestrial and freshwater ecosystems, but not wetlands explicitly. There could be some interesting variation between models as well as modelers in how to approach a wetland scenario. This scenario includes C-14 also, a radionuclide that has not been included in earlier WG4 scenarios. Participants are given measured radionuclide activity concentrations in soil, water, and air from wetland areas. No other parameters are specified in the scenario description. Participants are asked to estimate whole organism radionuclide activity concentrations in specified organisms. These include grasses, mosses, shrubs, trees, insects, small mammals, frogs and snakes. The resulting external and internal unweighted dose rates to these organisms should also be reported. Evaluation of the exercise will include: model-model comparisons of whole organism activity concentrations and doses model-measurement comparisons of whole organism activity concentrations and, for one species, external dose rate in soil. 2. Description of the wetland areas There are many different types of wetlands, i.e. marshes, swamps, fens and bogs. This exercise focuses on swamps in temperate regions. Swamps are forested wetlands dominated by trees or shrubs and often have a high biodiversity and productivity. Moreover, they are often riparian wetlands that are inundated by streams or rivers and thus, affected by overbank sedimentation. Therefore, wetlands may accumulate and function as sink for radionuclides. No comprehensive data are available from a single swamp so this scenario combines available data for different radionuclide-organism combinations from three different swamps: Steel Creek swamp (USA), Duke swamp (Canada), and Utnora swamp (Sweden). Steel Creek Steel Creek is c. 20 km long and drains a watershed of c. 290 km 2 . The creek is situated on the Savannah River Site, a US Department of Energy nuclear site in South Carolina, USA. The creek has received cooling water from nuclear reactors and about 10.35 TBq of 137 Cs were discharged down Steel Creek between the years 1954 and 1974. A wide wetland floodplain borders the main channel of the creek, which divides and reforms around many small islands. The stream is shallow (generally < 1m) and ranges from 3-5 m in width. Within the wetland there are small sinks or potholes created by decaying tree stumps and erosion by previous floods. These areas contain stagnant water. In its lower reaches, the floodplains broaden and the creek enters a swamp delta. Soil has been sampled along three transects perpendicular to the stream and extending out to the limits of the lateral floodplains. These transects, named A-C, were located 15.5, 16.2 and 16.9 km downstream from the point of entry of reactor effluents (figure 1). Page 2 of 6

  3. FINAL version Figure 1 . Location of Steel Creek on the Savannah River Site in South Carolina, Duke swamp Duke Swamp is a 0.102 km 2 wetland in Canada that has received historical inputs of radionuclides, including 14 C and tritium, through ground water transport from a Waste Management Area situated approximately 400 m east of the swamp. Past assessments of the area have indicated that the primary contributor to radiation dose to resident flora and fauna is likely to be 14 C. The map below shows sampling points with sample IDs. The sampling points included in this wetland scenario are marked with an ellipse (Figure 2). The main contamination pathway for wildlife throughout the swamp is thought to be from 14 C volatilised into the atmosphere rather than via ground water transfer. Utnora swamp Utnora swamp (0.024 km 2 ) is a riparian swamp next to Verkmyra stream which flows out of Hille Lake, in the central-eastern part of Sweden. The swamp received fallout following the Chernobyl accident in 1986. Verkmyra stream floods the swamp every spring resulting in deposition of radioactive material, mainly 137 Cs. The map below (Figure 3) shows the sampling areas (A and B) that are included in this wetland scenario. Page 3 of 6

  4. FINAL version DSS-01 DSS-03  DSS-02   DSS-06  DSS-04 DSS-05   DSS-10  DSS-09  DSS-08  DSS-07  DSS-14 DSS-17  DSS-18  DSS-15 DSS-12  DSS-16   DSS-11   DSS-13  DSS-22  DSS-26 DSS-21  DSS-25   DSS-24 DSS-20 DSS-23    DSS-19  Waste management area DSS-33  DSS-30 DSS-32 DSS-31  DSS-29 DSS-28     Approx. 400 m DSS-35  DSS-34 DSS-40 DSS-39 DSS-38 DSS-37      DSS-27 DSS-36   DSS-41 DSS-43  DSS-42   DSS-45 DSS-44   DSS-46  DSS-52 DSS-47 DSS-49  DSS-51 DSS-50   DSS-48    DSS-58 DSS-56  DSS-55 DSS-57    DSS-54  DSS-53  DSS-60 DSS-62  DSS-61 DSS-59    DSS-65 DSS-63 DSS-66  DSS-64    DSS-68 DSS-67 DSS-69    0 50 100 meters Figure 2 . Duke Swamp with sampling points indicated by sample ID. The sampling points that are included in this exercise are marked with an ellipse. Page 4 of 6

  5. FINAL version Figure 3 . The Utnora Swamp in Sweden. Grey areas indicate wetland areas. Samples included in this scenario are taken in the areas indicated by the letters A and B, next to Verkmyra Stream. 3. Available data Activity concentrations of 137 Cs and 14 C in soil, water, and air from the three wetlands (Steel Creek, Duke, and Utnora) have been compiled from published and unpublished sources into an Excel spreadsheet (See INPUT DATA). Soil activity concentrations are presented on a dry weight basis; the soil at Duke Swamp has a 10% dry matter content. Water activity concentrations were measured in filtered water. Soil activity concentrations are given as mean, min and max values. Water activity concentrations are only available for Steel Creek and Utnora, and are given as mean values. Air and soil C-14 specific activities are available for Duke swamp and are given as mean, min and max values. If you require a value for the C content in air then we suggest using that given in IAEA TRS472. To convert the available 14 C specific activity concentrations (i.e. Bq 14 C kg -1 C) in soil to the activity concentrations (i.e. Bq kg -1 ) which are also presented in the scenario the mean soil organic matter content for the site (95.3 %) and an assumed C content of soil organic matter of 58 % were used. 4. Exercise instructions and reporting The participants are asked to estimate whole organism activity concentrations as well as unweighted internal, external, and total absorbed dose rates to the vegetation and animal species listed in Table 1. Page 5 of 6

  6. FINAL version Reported values should represent deterministically predicted best estimates of annual mean activity concentrations and doses for all individuals of a species residing in the wetland. In order to cover the range of biota activity concentrations measured within each wetland, best estimates of biota activity concentrations corresponding to minimum and maximum measured media activity concentrations should also be reported. The Excel spreadsheet contains an INPUT DATA worksheet that provides data for use in the estimations of activity concentrations and dose rates. The OUTPUT DATA worksheet should be used to record estimated activity concentrations and unweighted dose rates for the different locations and biota. PLEASE DO NOT ALTER THE FORMAT OF THE RESULTS SHEET . Table 1 . Summary of organisms for assessment. This is also provided in the Excel-spreadsheet. Wetland Vegetation Animal Steel Creek swamp Grasses, sedges, Alder tree Shrubs, Green tree frog, Aquatic snakes, Willows. Terrestrial snakes, Ducks Spiders, Beetles, Aphids, leafhoppers, cicadas, Grasshoppers, crickets Duke swamp Peat moss, Grass, Forbs, Ferns, Deer flies, horse flies, wasps and Cedar ( Thuja ), Balsam fir moths, American bullfrog, Green frogs, Northern leopard frog, Mink frog, Grey treefrog, Common garter snake, American toad, Deer mouse, Meadow vole, Northern short-tailed shrew, White-footed mouse, Carrion beetles, Utnora swamp Spruce, Fern, Alder tree, Forbs, Moor frog Sedges All columns that require an input from the participant in this exercise are shaded green in the OUTPUT DATA worksheet. Information on size, behavior, and habitats for the biota in this scenario can be found on websites such as: http://www.arkive.org/species/ARK/ http://en.wikipedia.org/wiki/Main_Page Results should be sent to Pal.Andersson@ssm.se cc ’ ed to nab@ceh.ac.uk Page 6 of 6

Download Presentation
Download Policy: The content available on the website is offered to you 'AS IS' for your personal information and use only. It cannot be commercialized, licensed, or distributed on other websites without prior consent from the author. To download a presentation, simply click this link. If you encounter any difficulties during the download process, it's possible that the publisher has removed the file from their server.

Recommend


More recommend