
SLIDE 1
EMERALD LAKE HEIGHTS SEWER MAINTENANCE DISTRICT Information on - - PowerPoint PPT Presentation
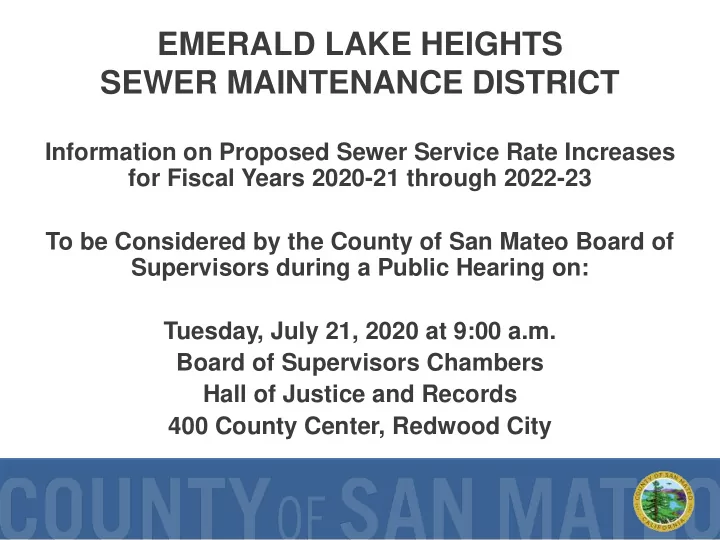
EMERALD LAKE HEIGHTS SEWER MAINTENANCE DISTRICT Information on Proposed Sewer Service Rate Increases for Fiscal Years 2020-21 through 2022-23 To be Considered by the County of San Mateo Board of Supervisors during a Public Hearing on: Tuesday,
Zone 2 Parcels
(1,760 to RWC)
Redwood Shores Redwood City Woodside Redwood City San Carlos San Carlos Belmont Zone 1 Parcels
(120 to San Carlos) (75 to RWC)
Image Source: Pixel-Gym
Source: City of San Mateo Clean Water Program.
*Age based on District formation date ** Based on 2019-20 Sewer Service Charge Report
District Age (yrs) *
Number of Connections **
Equivalent Residential Units (ERU) Downstream Transport Agency Treatment Facility ELHSMD Zone 1 73 191 209 City of San Carlos/City of Redwood City Silicon Valley Clean Water (SVCW) ELHSMD Zone 2 37 1,479 1,529 City of Redwood City District Miles of Pipe Percentage in Easements Percentage in Streets ELHSMD Zone 1 2.3 64.5% 35.5% ELHSMD Zone 2 27.6 37.4% 62.6%
General County Tax 22.31% City of RWC Area 1 25.40% RWC Elem School 22.25% SU High School Dist 14.70% SM Jr. College 6.38% ELHSMD (Zone 1) 1.80% Mid Pen ROSD 1.73% Air Quality Mngmnt 0.20% County Harbor District 0.33% Mosquito Abatement 0.18% Sequoia Hospital Dist 1.38% County Education Tax 3.33%
ELHSMD (Zone 1) Sample Property Tax Allocation (TRA 009-033)
Note: No Property Tax Revenue Allocation for Zone 2 – Formed After Proposition 13
Note: ELHSMD allocation of a portion (1.80%) of the property tax is $21,751 for FY 2018-19.
In May 2020 due to COVID-19 shelter-in-place orders and to increase awareness about not flushing cleaning and sanitizing “flushable wipes” the above message was added to the sewer district website: http://www.smcgov.org/sewers
Beginning in 2012, brochures have been distributed to customers during service calls and mailed to customers upstream of a sanitary sewer overflow. Copies are also available on website at http://www.smcgov.org/sewers
Source: Silicon Valley Clean Water
$451,896 $501,279 $1,112,905 $546,137 $572,565 $595,736 $71,232 $756,158 $10,393 $- $450,000 $1,000,000 $500,000 $1,000,000 $1,561,118 $1,637,265 $1,710,941 $1,787,934 $1,868,391 $1,952,468 $2,586,119 $3,398,709 $3,228,664 $2,909,300 $3,036,154 $3,037,874
$1,177,405 $1,668,884 $2,172,892 $2,127,709 $1,702,938 $1,798,137
$0 $500,000 $1,000,000 $1,500,000 $2,000,000 $2,500,000 $3,000,000 $3,500,000 $4,000,000 $0 $500,000 $1,000,000 $1,500,000 $2,000,000 $2,500,000 $3,000,000 $3,500,000 $4,000,000 2018-19 Actual 2019-20 Estimated 2020-21 Estimated 2021-22 Estimated 2022-23 Estimated 2023-24 Estimated
O&M and Regulations District CIP Repair Construction Transport & Treatment Revenue* (w/ proposed and estimated future rate increases) Fund Balance (Beg. FY)
Sewer Service Rate ($/Year Per Equivalent Residential Unit) Current Rate FY 2019-20 Proposed Rates FY 2020-21 FY 2021-22 FY 2022-23 Emerald Lake Heights SMD $1,490 $1,565
(+ $75/yr or $6.25/mo)
$1,640
(+ $75/yr or $6.25/mo)
$1,715
(+ $75/yr or $6.25/mo)