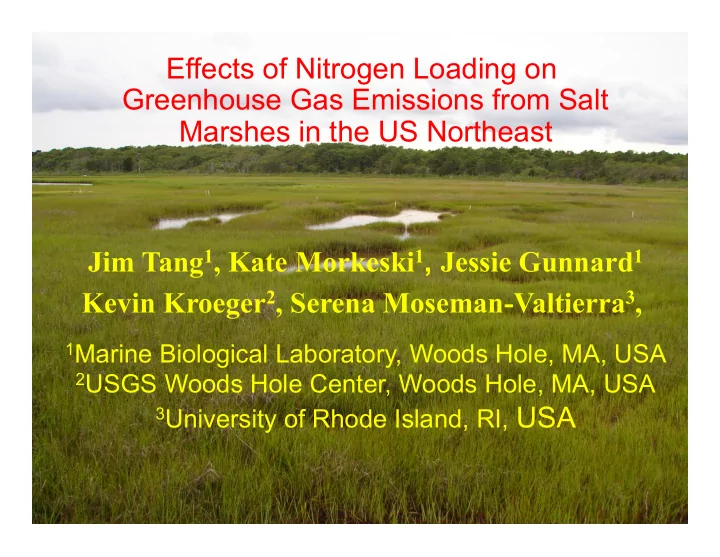

Effects of Nitrogen Loading on Greenhouse Gas Emissions from Salt Marshes in the US Northeast Jim Tang 1 , Kate Morkeski 1 , Jessie Gunnard 1 Kevin Kroeger 2 , Serena Moseman-Valtierra 3 , 1 Marine Biological Laboratory, Woods Hole, MA, USA 2 USGS Woods Hole Center, Woods Hole, MA, USA 3 University of Rhode Island, RI, USA
Atmospheric GHG concentration N 2 O CO 2 CH 4 IPCC 2007
IPCC emissions factor for N 2 O • 1% of fertilizer N (IPCC 2007) • 2.5% of fertilizer N (Davidson 2009) • 3-5% of fertilizer N (Crutzen et al. 2008) Can we simply use the emissions factor to calculate N 2 O emissions?
Questions • With N loading, how much N is released as gases (including N 2 O), how much is retained, and how much is taken away by tidal water? • How does N loading change CO 2 and CH 4 fluxes and carbon sequestration in soils?
Conceptual framework N
GHG and carbon sequestration CO 2 equivalent = net CO 2 flux + CH 4 flux * 25 + N 2 O flux * 298 Net ecosystem C balance (NECB) NECB = NEP – RCH 4 – FL. NEP: net ecosystem production of CO 2 , measured with the closed transparent chamber RCH 4 : CH 4 flux measured simultaneously with NEP. FL: net lateral flux
Study sites Mid N High N Low N No N
Vertical ¡GHG ¡Flux ¡Measurement ¡Locations = ¡Marsh ¡zone ¡comparison ¡(Serena) = ¡Nitrogen ¡site ¡comparison ¡(Jim ¡T.)
GHG flux measurement
Gas concentration CO 2 inside the chamber CH 4
Preliminary results CO 2 uptake in salt marshes 0 -1 -2 CO 2 flux ( µ mol m -2 s -1 ) -3 -4 -5 -6 -7 Eel Pond Great Pond (High N) (Low N) Measured on 9/12/2012 daytime
3.5 3.0 CH 4 flux (nmol m -2 s -1 ) 2.5 CH 4 and N 2 O 2.0 1.5 emissions in 1.0 0.5 salt marshes 0.0 0.04 0.03 N 2 O flux (nmol m -2 s -1 ) 0.02 0.01 0.00 Great Pond Eel Pond (Low N) (High N) Measured on 9/12/2012
Preliminary conclusion • CO 2 uptake in salt marshes may increase with N loading, but CH 4 and N 2 O emissions also increase with N loading.
Acknowledgement Funding: • NOAA/National Estuarine Research Reserve System Science Collaborative • NSF/MRI • USGS Collaborators: • Neil Ganju, Omar Abdul-Aziz, WBNERR staff
Recommend
More recommend