
SLIDE 1
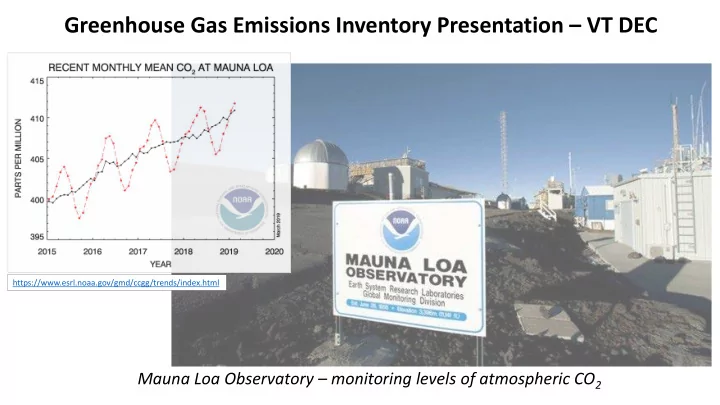
Mauna Loa Observatory – monitoring levels of atmospheric CO2
Greenhouse Gas Emissions Inventory Presentation – VT DEC
https://www.esrl.noaa.gov/gmd/ccgg/trends/index.html
Greenhouse Gas Emissions Inventory Presentation VT DEC - - PowerPoint PPT Presentation
Greenhouse Gas Emissions Inventory Presentation VT DEC https://www.esrl.noaa.gov/gmd/ccgg/trends/index.html Mauna Loa Observatory monitoring levels of atmospheric CO 2 Greenhouse Gas (GHG) Emissions in Vermont Greenhouse Gas Emissions
https://www.esrl.noaa.gov/gmd/ccgg/trends/index.html
3
2028 Goal: 4.30 MMTCO2e (50% below 1990 totals) 2030 Goal: 5.16 MMTCO2e NEG-ECP / VT CEP (40% below 1990 totals) 2050 Goal: 2.15 MMTCO2e (75% below 1990 totals) 2012 Goal: 6.45 MMTCO2e (25% below 1990 totals) 2050 Goal (high end): 1.72 MMTCO2e (80% below 1990 levels) -VT CEP 2016 2050 Goal: (low end): 0.43 MMTCO2e (95% below 1990 levels) -VT CEP 2016 0.00 2.00 4.00 6.00 8.00 10.00 12.00
1990 1992 1994 1996 1998 2000 2002 2004 2006 2008 2010 2012 2014 2016 2018 2020 2022 2024 2026 2028 2030 2032 2034 2036 2038 2040 2042 2044 2046 2048 2050 GHG Emissions (MMTCO2e)
4
Electricity (consumption based) 10.0% Res/Com Fuel Use 23.9% Industrial Fuel Use 3.9% Transportation 43.3% Fossil Fuel Industry 0.05% Industrial Processes 5.8% Waste 1.7% Agriculture 11.4%
Electricity Generation 29.6% Res/Com Fuel Use 10.4% Industrial Fuel Use 13.9% Transportation 28.4% Fossil Fuel Industry 3.1% Industrial Processes 4.4% Waste 2.3% Agriculture 7.8%
8