Effects of nicotine on neuronal firing patterns in human subthalamic - - PDF document

effects of nicotine on neuronal firing patterns in human
SMART_READER_LITE
LIVE PREVIEW

Effects of nicotine on neuronal firing patterns in human subthalamic - - PDF document

Effects of nicotine on neuronal firing patterns in human subthalamic nucleus SURF paper draft: September 26, 2008 Kim Scott Mentor: Henry Lester Co-mentor: Shawna Frazier Abstract. Nicotine is the primary psychoactive and additive understanding


slide-1
SLIDE 1

Effects of nicotine on neuronal firing patterns in human subthalamic nucleus

SURF paper draft: September 26, 2008 Kim Scott Mentor: Henry Lester Co-mentor: Shawna Frazier

  • Abstract. Nicotine is the primary psychoactive and additive

component of tobacco, which may have a protective effect against Parkinson’s Disease (PD). We present analyses of preliminary single-electrode recordings from subthalamic nucleus conducted during implantation of stimulating electrodes for deep-brain stimulation in a small group (n = 7)

  • f PD patients in a novel experimental setup. During the

recording period, both a moderate dose of nicotine and a placebo saline solution are administered nasally. Neuronal spikes are detected and sorted using the Osort algorithm developed by Rutishauser et al. at Caltech. We present information about the characteristics of the resulting spike trains, in particular the strength and frequency of 1-2 Hz bursting oscillations, and make recommendations for changes to the experimental setup for planned future recordings. ___________________________________

  • 1. Introduction

Nicotine is the primary psychoactive and addictive component

  • f tobacco products, which may have neuroprotective effects

against Parkinson’s Disease (PD) and Alzheimer’s. Adjusting for increased mortality, smokers are still relatively unlikely to develop PD, which results from loss of dopaminergic neurons in the substantia nigra. The degeneration of these neurons is characterized by specific pathological firing patterns, including excessive bursting and synchronization (Garcia et al. 2005; Levy et al. 2000). The protective effects of smoking have been demonstrated in both prospective and retrospective studies (Quik et al. 2007) and in identical twins discordant for PD and smoking (Lester 2007). Similar effects have been discovered in culture and animal models (Quik et al. 2007), suggesting that nicotine is the component of tobacco to confer the benefits of smoking. Despite the drug’s widespread use, the effects of chronic nicotine exposure on neural circuitry are not well

  • characterized. Nicotine binds to nicotinic acetylcholine

receptors, ligand-gated cation channels present in the cholinergic system. Chronic exposure to nicotine causes an increase in the number of nicotinic receptors with α4 subunits in inhibitory GABAergic neurons of the ventral tegmental area and substantia nigra, part of the collection of structures called the basal ganglia (see Figure 1). This upregulation in turn diminishes the response of dopaminergic neurons to nicotine (Nashmi et al. 2007). Suppression of the direct response of dopaminergic neurons to nicotine has been confirmed in mouse midbrain, and is likely to occur in other basal ganglia and thalamic structures as well (Lester 2007). It has been hypothesized that the same mechanism underlying the addictive properties of nicotine may also be responsible for the purported neuroprotective effects against the neurodegenerative progression characteristic of PD. An understanding of the short-term changes induced by nicotine

  • n single cells is required to evaluate the dominance of

inhibition in nicotine tolerance and neuroprotection. In order to assess the effects of nicotine in the basal ganglia at the single-cell level, we have utilized recordings taken during the implantation of electrodes for deep-brain stimulation (DBS), an established surgical therapy for PD that reduces motor symptoms and medication needs. The data presented here from seven patients, two of whom are smokers, are part of a broader scheme to compare the firing patterns of neurons in the basal ganglia in smokers and non-smokers.

  • 2. Methods

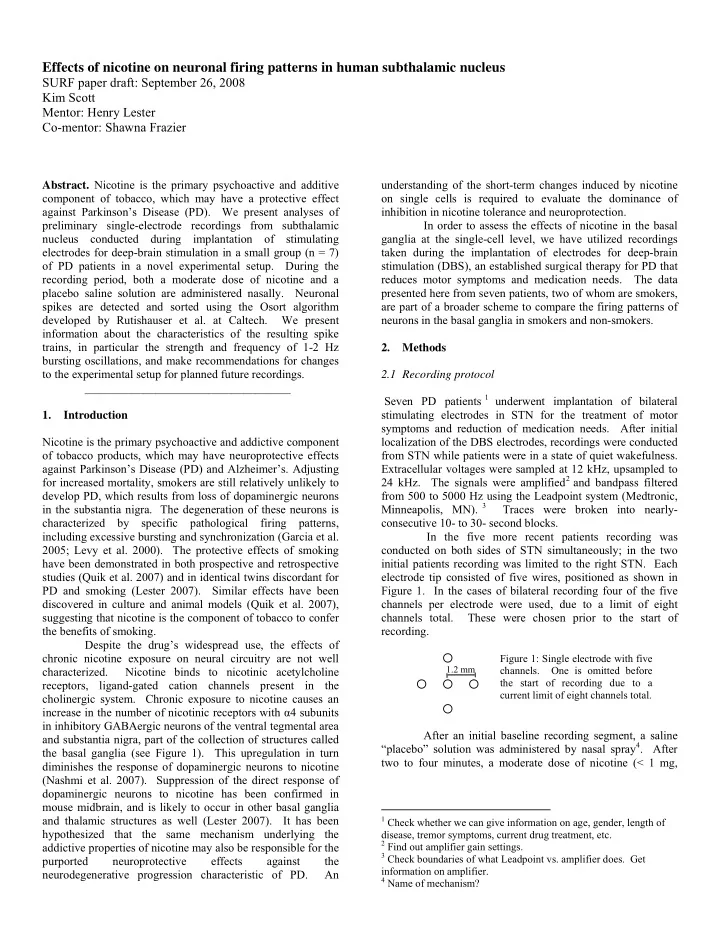
2.1 Recording protocol Seven PD patients 1 underwent implantation of bilateral stimulating electrodes in STN for the treatment of motor symptoms and reduction of medication needs. After initial localization of the DBS electrodes, recordings were conducted from STN while patients were in a state of quiet wakefulness. Extracellular voltages were sampled at 12 kHz, upsampled to 24 kHz. The signals were amplified2 and bandpass filtered from 500 to 5000 Hz using the Leadpoint system (Medtronic, Minneapolis, MN). 3 Traces were broken into nearly- consecutive 10- to 30- second blocks. In the five more recent patients recording was conducted on both sides of STN simultaneously; in the two initial patients recording was limited to the right STN. Each electrode tip consisted of five wires, positioned as shown in Figure 1. In the cases of bilateral recording four of the five channels per electrode were used, due to a limit of eight channels total. These were chosen prior to the start of recording. After an initial baseline recording segment, a saline “placebo” solution was administered by nasal spray4. After two to four minutes, a moderate dose of nicotine (< 1 mg,

1 Check whether we can give information on age, gender, length of

disease, tremor symptoms, current drug treatment, etc.

2 Find out amplifier gain settings. 3 Check boundaries of what Leadpoint vs. amplifier does. Get

information on amplifier.

4 Name of mechanism?

1.2 mm

Figure 1: Single electrode with five

  • channels. One is omitted before

the start of recording due to a current limit of eight channels total.

slide-2
SLIDE 2

comparable to the amount absorbed when smoking a cigarette) was administered by the same mechanism5. Recordings were broken into segments by condition (baseline, placebo, or nicotine), separated by unrecorded delays of several seconds6. Placebo controls were absent in the two initial patients. The recording lengths and electrode positions are summarized in Table 1. 2.2 Data analysis Several forms of artifacts were removed from the raw traces:

  • 1. In three patients, all wires were briefly disconnected at the

start of baseline recording. The first 500 – 700 ms, as necessary, were omitted from analysis in these cases.

  • 2. The amplifier gain settings occasionally changed during
  • recording. These gain changes were identified visually

using the background level and characteristic single- timesample artifacts preceding changes in gain, and periods of increased or decreased gain were scaled

  • linearly. An example is shown in Figure 2. In one patient

(VOG) an increase in gain during the nicotine recording

5 Need citation regarding speed of absorption, also regarding amount

  • f nicotine in a cigarette.

6 So any information about the absolute phase of oscillatory activity

was lost.

caused the signal to go out of range for 18 seconds. This period was omitted from further analysis.

  • 3. Movement artifacts were present in patient WEN during

the baseline recording and in patient BOE during the nicotine recording. The period of disturbance and following silence were removable in WEN but not BOE. Spike detection and sorting were performed on 27 channels with visually identified possible unit activity using the open-source online algorithm Osort developed by Rutishauser et al. (2006). Spike detection was performed in blocks of approximately 20 seconds on the individual conditions using the local power signal p(t) and a threshold of mean(p) + 4*std(p). The spikes detected in each condition were then pooled and sorted together. Alignment of peaks was initially based on the timing of the first significant peak, then refined to the maximum or minimum when all average cluster waveforms in the channel had a larger peak than trough

  • r vice versa. Clusters were included only if

i. the fraction of interspike intervals (ISIs) under 1000 ms which were also under 3 ms was less than 2.5%, and ii. the overall firing rate was at least 0.5 Hz in at least

  • ne condition.

No accepted clusters had a significant (> 3 std. from the mean) “interference peak” in the power spectrum of the 1-ms-binned patient Smoker ? (daily) Positions

  • f

clear signals Bl (s) Pc (s) Nic (s) BOE yes L cent, R cent 390 210 750 HAE yes L lat, R cent, R ant, R lat 240 180 300 KUE no L cent, L ant, R cent, R ant 360 240 300 LUD no L cent, L ant, L lat, R cent, R lat 210 200 280 VOG no L cent, L lat, R cent, R ant, R med 300 150 330 WEN no R ant 148 n/a 299 ZAB no R cent, R ant, R med, R lat 210 n/a 299

Table 1: Summary of available data from PD patients. Bl = baseline, Pc = placebo, Nic = nicotine. Positions are left (L) and right (R) central, lateral, anterior, and medial. Above: Figure 3. Cluster 2039 in patient KUE, channel 1. (a) Upsampled waveforms of all included spikes in red, average waveform in blue. (b) Normalized autocorrelogram with baseline subtracted. (c) Typical ISI histogram of a bursting but non-oscillating cluster. Left: Figure 2: Removal of gain artifact in patient LUD, channel 2, nicotine recording. (a) Raw trace, with clear variation in amplifier settings. (b) After scaling.

slide-3
SLIDE 3

spike train at 50 Hz. Due to a visually clear slow modulation

  • f spike amplitude in HAE channel 4, the detected waveforms

(with initial positive peaks of various amplitudes) were merged into a single cluster. A sample sorted cluster is shown in Figure 3. Analysis of firing patterns was performed using MATLAB (The MathWorks, Natick, MA). The burst propensity of a cluster was defined as the fraction of ISIs between 3 and 10 ms. The spike width was defined as the time between peak and trough of the average waveform after upsampling to 100 kHz. Autocorrelations and power spectra

  • f the 1-ms-binned spike trains were computed. The clipped

auto-intensity with clipping width τ, defined by Hahnloser (2007) as the probability of observing at least one spike in the interval (s + t - τ/2, s + t + τ/2) given that there is a spike at time s, was additionally used to study oscillations in firing rate. Unless otherwise noted, comparisons of conditions were made by 2-sample t-tests or, when the Lillilifors test of normality rejected the null hypothesis of a distribution in the normal family for one or more of the samples, by the Wilcoxon two- sided rank sum test. Significance was set at α = 0.05.

  • 3. Results

Sorting yielded a total of 47 clusters from 25 channels, with a mean overall firing rate of 5.41 Hz +/- 5.2 Hz and mean

  • verall burst propensity of 6.6% +/- 6.5 %. Nicotine had no

significant effect on firing rate, burst propensity, or coefficient

  • f variance of the ISI distribution (p > 0.2).

Many clusters were characterized by bursting

  • scillations at 1-2 Hz, visible in the raw traces and more

clearly in the autocorrelation (AC) of the 1-ms-binned

  • spiketrain. A measure of oscillation strength was defined as

the difference between (a) the peak of the power spectrum of the AC (8192 points, 0.12 Hz resolution, DC component removed) in the range 0.8 to 2 Hz and (b) the mean power in the range 0 to 50 Hz, normalized by the standard deviation of the power in this range. Detection of significant oscillation was then performed against the null hypothesis of a renewal process by re-computing this measure 200 times per cluster after shuffling the ISIs (Perkel et al. 1967). Significant

  • scillation, defined as α < 0.05 (that is, a strength greater than

at least 95% of those generated by shuffled ISIs), was detected in 68 conditions (52%) across 30 clusters. Detection of

  • scillation using the autointensity with clipping width τ equal

to the median of the ISI distribution yielded similar results. No significant oscillation was detected in neurons from patient KUE. In conditions with significant oscillation and at least 200 spikes, the ACs were normalized to the length of recording and fitted to the model of exponential locking to a free oscillator (ELO) proposed by Schneider (2008). A sample set of fitted ACs is shown in Figure 5. The model assumes a stationary point “packet onset process” with inter- packet intervals distributed ~ N(µ, σ2) to which an average of α spikes of firing density exponentially decaying with τ are

  • locked. This gives the AC at time s as

Fitting was performed using sufficient terms of the sum to account for bursts at the maximum frequency of interest during the entire computed AC (approximately 4 seconds). A trust-region algorithm was used to give robust behavior with respect to large minimal errors. The starting points of the parameters were given by where r was the overall rate in Hz, p the position of the peak

  • f the 100-ms Gaussian kernel smoothed autocorrelation, and

h the height of that peak. The definition of significant

  • scillation was further refined to fits with µ in the range 0.8 to

2 Hz and σ < .25*µ. The mean adjusted r-squared statistic for goodness of fit was 0.41. Oscillation was observed in 64 conditions across the same 30 clusters, with oscillation

  • bserved in all conditions in 19 clusters. In 16 clusters,
  • scillation was observed in all conditions.

Several measures of oscillation strength were computed: i. The width of the AC peak, defined as the duration for which the fitted curve was above the baseline level of n2b / T2, where n is the number of spikes, b the AC bin size, and T the length of recording (Dayan and Abbott 2001). This was not computed if the first AC peak did not cross baseline. ii. The peak to trough distance of the fitted curve, normalized by the baseline level. iii. The area under the raw from the position of the first to the second troughs of the fitted curve, with the trapezoid under the troughs subtracted. iv. The “rate of decay” of the AC, given by the ratio σ/µ, a measure of the variability of burst timing. Due to small but significant changes in oscillation frequency with nicotine, accurate measurement of the height

  • f the peaks of the AC power spectrum would have required

adjustment of the resolution to avoid systematic bias, so the

  • scillation score defined by Mureşan et al. (2008) was

inappropriate.

Figure 4: Bursting oscillation in channel 1, baseline, of patient VOG, visible at various timescales.

slide-4
SLIDE 4

Nicotine had no significant effect on width, peak-to- trough distance, area, or rate of decay σ/µ relative to either placebo or baseline. Changes in individual clusters, however, were often drastic: oscillation was in some cases either only significant or only insignificant in the nicotine condition. The frequencies of oscillation, 1/µ, were tightly clustered around a frequency specific to the patient, as in Levy (mean variance of frequencies across channels and conditions = 0.0022 Hz). The average frequency increased significantly in nicotine relative to both baseline and placebo in four patients (BOE, VOG, WEN, and ZAB). In LUD there was a decrease in frequency between baseline and nicotine, but no difference between placebo and nicotine. In HAE there was a decrease in frequency between baseline and placebo, followed by an increase between placebo and nicotine. In VOG, the difference between the frequencies in right and left STN increases with nicotine, suggesting a possible decrease in bilateral synchrony; correspondingly, the decay rates increase. A full table of the oscillating clusters is given in Appendix A.

  • 4. Discussion

PD is associated with an increased discharge rate in STN, demonstrated in both monkeys (Bergman 1994) and humans (Steigerwald 2008). Thus, the simplest possible effect of nicotine might be to decrease the overall rate of firing.7 We did not observe a decrease in neuronal firing rates. However,

  • ur spike rates averaging 5 Hz are much lower than those

generally reported in the STN of PD or ET patients. Recorded rates of STN neurons include

  • 40.5 Hz (Steigerwald 2008)
  • 33 +/- 17 Hz overall and 25 +/- 12 Hz in oscillating

cells (Rodriguez-Oroz et al. 2001)

  • 37 +/- 17 Hz (Hutchison et al. 1998)
  • 69 +/- 32 Hz in rhythmic firing cells with peaks at 40

and 90 Hz (Magarinos-Ascone 2000)

  • 41 +/- 21 Hz, or 26 +/- 6 Hz during sleep (Magnin

2000)

  • 47 Hz (Sterio 2002);
  • 14 – 52 Hz (Kim 2006)

7 Discuss first what we might actually EXPECT: what areas have

nAChRs, and what effect would their activation have in STN?

Our abnormally low rates may be due to an overly conservative threshold during detection; use of a lower threshold is in progress and does not seem to affect higher- level measures of firing patterns. Due to the large background and irregularly firing neurons, it seems likely that the recordings do come from STN. However, the recordings are much clearer during initial localization of electrode placement, and are degraded once the recording electrodes are returned to

  • STN. It is possible that spikes observed in the initial

recordings would not only display higher firing rates, but fall more neatly into the established categories of STN neurons: irregular, tonic, and oscillatory/bursting (Rodriguez-Oroz 2001, Magarinos-Ascone 2000, Steigerwald 2008). In five cases, a cluster was detected only during the nicotine condition, but in four of these this rate increase corresponded to a rate decrease in another cluster on the same

  • channel. This suggests that the original cluster, detected in

baseline and placebo, was artificially split during the nicotine recording, which may reflect either a change in average waveform or an increase in variability of waveform. This will be examined by more detailed analysis of the average waveform over time, although it is difficult to make subtle comparisons of shape with only around 12 true data points per

  • spike. A sudden change in waveform shape during nicotine is

possible if different synapses are contributing to the action potential. The cause of the 1-2 Hz oscillation observed is unknown, but similar oscillation was observed in smaller fraction of neurons by Rodriguez-Oroz et al. (2001). STN receives two primary connections: an excitatory connection from cortex and an inhibitory connection from the globus pallidus pars externa (GPi). Either of these connections, or possibly more complex interaction among the basal ganglia and cortex, may lead to slow oscillation: bursting oscillation at similar frequencies has been observed when the STN and globus pallidus pars externa (GPe) feedback network is grown in culture (Plentz and Kital 1999) and coupled to slow-wave electroencephalogram activity in prefrontal cortex (Magill et

  • al. 2001). Oscillation at tremor- and higher frequencies has

also been observed in STN (Levy 2000, Steigerwald 2008, Rodriguez-Oroz 2001). The current main priority in analysis is the measurement of degree and phase of synchrony among simultaneously recorded neurons. This analysis may be aided by the use of a lower threshold, as false negatives artificially decrease synchrony to a greater extent than do false positives (Pazienti & Grun 2006). The algorithm proposed by Schneider (2006) to assign a global phase offset to each cluster will be implemented if the phase offsets are additive, and the spike trains realigned and pooled together. The AC of the combined spike train can then be studied as were the individual ACs, as well as compared to a theoretical maximum based on the contributing spike trains, in order to determine the strength of synchronous oscillatory activity. In the case of non-additive phase offsets, pairwise coherence techniques may be used as in Levy, adjusting the resolution of the power spectrum based on a fit to the cross-correlation in order to accurately measure the power at the frequency of oscillation (Scott 2006). Main questions include whether nicotine and/or distance affect phase or coherence. We expect coherence to depend on distance in particular if cortical activity drives

Figure 5: Smoothed and fitted ACs in patient VOG, channel 6, cluster 1729.

slide-5
SLIDE 5
  • scillation in STN, since neighboring STN neurons share

cortical input in the rat (Ryan 1992). Other plans include the examination of tremor- and higher-frequency oscillation, which are present in some auto- and cross-correlations. The spike density function, rather than the simple 1-ms binned binary spike train, will be used for future autocorrelation analysis, as described in Szucs (1998). In order to demonstrate that the 1-2 Hz oscillation

  • bserved is not heartbeat-related, we plan to record a

simultaneous ECG channel in a future patient. Because nicotine burns and creates an odor, an active nicotine placebo as reported in Domino et al. (2000) is being considered in place of the saline solution.

  • 5. Acknowledgments

The data presented here are part of an experiment planned and executed by Professor Henry Lester at Caltech and Professor Dr. Johannes Schwarz at the Universitat Leipzig

  • Hospital. I am indebted to Professors Lester and Schwarz for

their guidance, as well as my co-mentor Shawna Frasier and to

  • Dr. Ueli Rutishauser for assistance with Osort.

This research was supported by a Richter fellowship administered through the Caltech SURF program.

  • 6. References

Bergman, H., T. A. Wichmann, et al. (1994). "The primate subthalamic nucleus. II. Neuronal activity in the MPTP model of Parkinsonism." J Neurophysiol 72(2): 507-520. Dayan, P. and L. Abbott (2001). Theoretical Neuroscience. Cambridge, MIT Press. Domino, E. F., S. Minoshima, et al. (2000). "Nicotine effects

  • n regional cerebral blood flow in awake, resting

tobacco smokers." Synapse 38: 313-321. Garcia, L., G. D'Alessandro, et al. (2005). "High-frequency stimulation in Parkinson's disease: more or less?" TRENDS in Neurosciences 28(4): 209-216. Hahnloser, R. H. R. (2007). "Cross-intensity functions and the estimate of spike-time jitter." Biological Cybernetics 96: 497-506. Hutchison, W., R. Allan, et al. (1998). "Neurophysiological identification of the subthalamic nucleus in surgery for Parkinson's disease." Ann Neurol 44(4): 622-8. Ji, S., T. Tosaka, et al. (2002). "Differential rate responses to nicotine in rat heart: evidence for two classes of nicotinic receptors." The Journal of Pharmacology and Experimental Techniques 301(3): 893-899. Kim, M. S., Y. T. Jung, et al. (2006). "Microelectrode recording: lead point in STN-DBS surgery." Acta Neurochir Suppl 99: 37-42. Lester, H. A. (2008). Chronic nicotine: cell-specific receptor and circuit alterations in basal ganglia, National Institutes of Health, grant proposal: 79 pages. Levy, R., W. D. Hutchison, et al. (2000). "High-frequency synchronization of neuronal activity in the subthalamic nucleus of Parkinsonian patients with limb tremor." The Journal of Neuroscience 20(20): 7766-7775. Magarinos-Ascone, C., R. Figueiras-Mendez, et al. (2000). "Subthalamic neuron activity related to tremor and movement in Parkinson's disease." Eur J Neurosci 12(7): 2597-607 Magill, P. J., J. P. Bolam, et al. (2001). "Dopamine regulates the impact of the cerebral cortex on the subthalamic nucleus-globus pallidus network." Neuroscience 106(2): 313-330. Magnin, M., A. Morel, et al. (2000). "Single-unit analysis of the pallidum, thalamus and subthalamic nucleus in Parkinsonian patients." Neuroscience 96(3): 549-564. Mureşan, R. C., O. F. Jurjuţ, et al. (2008). "The oscillation score: an efficient method for estimating oscillation strength in neuronal activity." J Neurophysiol 99: 1333-1353. Nashmi, R., C. Xiao, et al. (2007). "Chronic nicotine cell specifically upregulates functional α4* nicotinic receptors: basis for both tolerance in midbrain and enhanced long-term potentiation in perforant path" The Journal of Neuroscience 27(31): 8202-8218. Pazienti, A. and S. Grün (2006). "Robustness of the significance of spike synchrony with respect to sorting errors." J Comput Neurosci 21: 329-342. Perkel, D. H., G. L. Gerstein, et al. (1967). "Neuronal spike trains and stochastic point processes: I. The single spike train." Biophysical Journal 7: 391-418. Plentz, D. and S. T. Kital (1999). "A basal ganglia pacemaker formed by the subthalamic nucleus and external globus pallidus." Nature 400: 677-682. Quik, M., T. Bordia, et al. (2007). "Nicotinic receptors as CNS targets for Parkinson's disease." Biochemical Pharmacology 74: 1224-1234. Raz, A., V. Frechter-Mazar, et al. (2001). "Activity of pallidal and striatal tonically active neurons is correlated in MPTP-treated monkeys but not in normal monkeys." J Neurosci 21: 5. Rodriguez-Oroz, M. C., M. Rodriguez, et al. (2001). "The subthalamic nucleus in Parkinson's disease: somatopic organization and physiological characteristics." Brain 124: 1777-1790. Rutishauser, U., E. M. Schuman, et al. (2006). "Online detection and sorting of extracellularly recorded action potentials in human medial temporal lobe recordings, in vivo." Journal of Neuroscience Methods 154: 204-224. Ryan, L. J., D. J. Sanders, et al. (1992). "Auto- and cross- correlation analysis of subthalamic nucleus neuronal activity in neostriatal- and globus pallidal-lesioned rats." Brain Res 583: 253-61. Schneider, G. (2006). "Spatiotemporal structure in large neuronal networks detected from cross-correlation." Neural Computation 18: 2387-2413. Schneider, G. (2008). "Messages of oscillatory correlograms: a spike train model." Neural Computation 20: 1211- 1238. Scott, S. (2006, September 26, 2008). "A method to compute accurate FFT amplitudes." MSE memo Retrieved 9/26/08, from https://www.psfc.mit.edu/~sscott/MSEmemos/mse_ memo_54b.pdf. Steigerwald, F., M. Pötter, et al. (2008). "Neuronal activity of the human subthalamic nucleus in the Parkinsonian

slide-6
SLIDE 6

and non-Parkinsonian state." J Neurophysiol: In press. Sterio, D., M. Zonenshayn, et al. (2002). "Neurophysiological refinement of subthalamic nucleus targeting." Neurosurgery 50(1): 58-69. Szucs, A. (1998). "Applications of the spike density function in analysis of neuronal firing patterns." Journal of Neuroscience Methods 81: 159-167.

slide-7
SLIDE 7

r

  • 7. Appendix A

Frequency of oscillation Decay rate σ/µ Width of AC peak Peak‐trough distance Area under AC peak Patient channel cluste baseline placebo nicotine baseline placebo nicotine baseline placebo nicotine baseline placebo nicotine baseline placebo nicotine PDBOE 1 2320 0.951 0.971 1.107 0.015 0.003 0.109 0.635 0.545 0.549 0.164 0.423 1.038 22.464 28.481 62.595 PDBOE 5 1026 0.942 0.998 0.113 0.082 0.544 0.467 0.429 0.735 4.798 1.201 PDHAE 4 1 1.283 1.277 1.284 0.083 0.069 0.077 0.364 0.355 0.337 0.911 0.788 0.631 46.488 40.890 99.605 PDHAE 5 973 1.284 1.270 1.282 0.076 0.065 0.069 0.326 0.324 0.318 1.483 1.582 1.937 8.762 8.485 18.644 PDHAE 6 1082 1.280 1.275 1.281 0.020 0.054 0.020 0.362 0.321 0.335 0.726 1.138 0.716 28.461 32.178 55.848 PDHAE 8 693 1.299 0.057 0.329 2.282 0.095 PDHAE 8 950 1.279 1.269 1.286 0.097 0.044 0.079 0.348 0.316 0.343 0.189 0.504 0.865 38.309 21.074 22.843 PDLUD 1 876 1.746 1.675 0.049 0.036 0.457 0.231 2.401 1.142 0.171 0.116 PDLUD 1 947 1.729 1.684 1.686 0.049 0.068 0.047 0.250 0.237 0.305 0.629 0.241 0.473 6.051 5.739 16.673 PDLUD 2 1186 1.732 1.703 1.682 0.045 0.053 0.054 0.250 0.245 0.245 1.116 1.047 1.144 20.159 16.450 11.475 PDLUD 4 1075 1.738 1.691 0.050 0.044 0.253 0.343 0.509 0.373 10.787 8.971 PDLUD 5 1027 1.684 0.059 0.378 4.658 1.746 PDLUD 5 1107 1.689 0.067 0.111 12.158 PDVOG 1 931 1.432 1.430 1.526 0.053 0.019 0.095 0.317 0.295 0.298 1.085 1.142 1.138 2.949 1.098 1.149 PDVOG 1 901 1.436 1.433 1.506 0.049 0.048 0.094 0.268 0.249 0.264 3.478 3.220 3.162 7.752 4.065 6.555 PDVOG 4 915 1.418 1.444 0.012 0.000 0.180 0.061 12.785 5.915 PDVOG 5 1168 1.195 0.002 0.447 0.880 0.054 PDVOG 5 889 1.461 0.123 0.372 0.679 4.875 PDVOG 6 1625 1.564 0.030 0.297 10.602 1.057 PDVOG 6 1721 1.557 0.032 0.288 8.354 0.971 PDVOG 6 1729 1.435 1.436 1.469 0.051 0.049 0.065 0.285 0.284 0.383 1.092 1.132 1.249 49.463 28.189 12.745 PDVOG 7 1492 1.435 1.431 1.480 0.023 0.030 0.040 0.317 0.262 ‐1.000 0.180 0.154 0.072 41.137 28.636 14.099 PDWEN 5 661 1.210 1.250 0.070 0.105 0.355 0.373 0.944 0.742 43.748 66.013 PDZAB 4 543 1.275 0.053 0.303 2.110 0.077 PDZAB 4 619 1.277 0.052 0.319 2.446 1.004 PDZAB 4 623 1.216 1.272 0.096 0.058 0.368 0.324 1.133 2.357 9.817 8.948 PDZAB 5 737 1.216 1.274 0.090 0.045 0.361 0.327 1.179 0.495 15.927 33.319 PDZAB 7 623 1.190 1.284 0.006 0.050 0.468 0.212 1.277 5.093 11.753 PDZAB 8 409 1.272 0.060 0.332 1.371 4.349 PDZAB 8 407 1.195 1.270 0.058 0.063 0.336 0.340 3.282 1.735 5.738 2.214