
SLIDE 1
Economic evaluation of alternative management strategies for the - - PowerPoint PPT Presentation
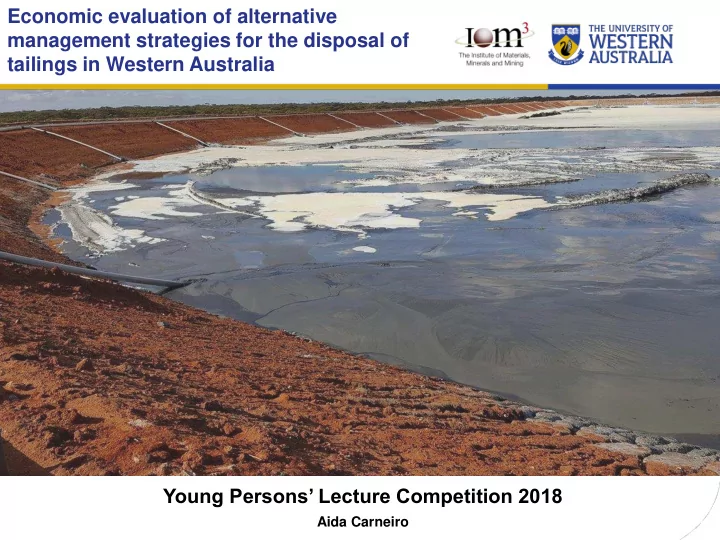
Economic evaluation of alternative management strategies for the disposal of tailings in Western Australia Young Persons Lecture Competition 2018 Aida Carneiro What are Tailings? Tailings are the non-economic product of the mineral
Run-of-mine (ROM) Mineral Processing Plant Tailings Tailings Storage Facilities (TSFs)
Concentrate
Source: http://www.huffingtonpost.ca/2011/11/29/48-billion-peru-gold-mi_n_1119767.html http://www.yestolifenotomining.org/tia-maria-shouts-to-defend-their-land-peru/
Source: Google Maps
Pond for surface water management Decant road
Source: Google Maps
Decant road
Thickener Thickener UF Pump Tailings Deposition Pipeline TSF
25 m Φ x 3m sidewall 10 x Centrifuge pumps 272 m3/h
200 mm Φ HDPE 4,640 m long
Source of Make-up Water Make-up Water Pipeline Make-up Water Pump Water Return Pump Water Return Pipeline
200 mm Φ HDPE 1,940 m long 180 mm Φ HDPE 5,000 m long 1,000 m away 5,000 m away 2 x Centrifuge pumps 104 m3/h 2 x Centrifuge pumps 85 m3/h
Spigot Dropper
Thickener Thickener UF Pump Tailings Deposition Pipeline TSF
25 m Φ x 4.5m sidewall 1 x Piston-diaphragm PD pump, 208 m3/h
200 mm Φ HDPE 2,121 m long
Source of Make-up Water Make-up Water Pipeline Make-up Water Pump Water Return Pump Water Return Pipeline
225 mm Φ HDPE 1,038 m long 225 mm Φ HDPE 5,000 m long 1,000 m away 5,000 m away 125 m3/h – 6 months
Pond for Water Management
125 m3/h – 6 months
Filter Cake Tailings Transport by Truck TSF
289 t/h
Source of Make-up Water Make-up Water Pipeline Make-up Water Pump Water Return Pump Water Return Pipeline
160 mm Φ HDPE 1,000 m long 160 mm Φ HDPE 5,000 m long 1,000 m away 5,000 m away 58 m3/h – 6 months
Pond for Water Management
58 m3/h – 6 months
Fast-opening Filter Press Tailings Placement by Dozer
3 filters 60 chambers each
20 40 60 80 100 120 140 160
Millions
5 10 15 20 25 30 35
Millions
Dewatering Technology Thickener Underflow Pump Water Return Pump Make-up Water Pump Pipeline Earthworks
5 10 15 20 25 30 35 40 45 50 Increase TSF Capacity Tailings Thickening Filtration Tailings Transport and Placement Water Return Pumping Make-up Water Pumping MRF
Millions
Slurry Tailings Thickened Tailings Filtered Tailings
Direct and Indirect Financial Costs – Capital, Operational, and Closure Costs “Recognised” Contingent Costs A Broader Range of Direct, Indirect, Contingent and Less Quantifiable Costs - Environmental Costs External Social Costs Borne by Society - Social Costs
Conventional Cost Accounting Total Cost Assessment
Source: after International Institute for Sustainable Development, 2013
Full Cost Assessment