
SLIDE 1
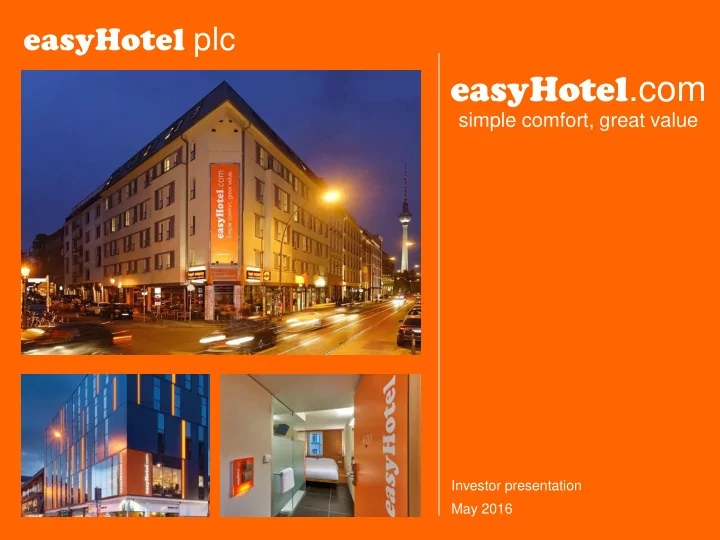
easyHotel plc
Investor presentation May 2016
easyHotel.com
simple comfort, great value
easyHotel .com simple comfort, great value Investor presentation - - PowerPoint PPT Presentation
easyHotel plc easyHotel .com simple comfort, great value Investor presentation May 2016 Disclaimer This presentation (this "presentation" ) is for general information only and is the property of easyHotel plc ( " easyHotel
easyHotel plc
Investor presentation May 2016
simple comfort, great value
easyHotel plc
p2
Disclaimer
this presentation available in no circumstances whatsoever implies the existence of a commitment or contract by or with easyHotel, or any of its affiliated entities, or any of its or their respective subsidiaries, directors, officers, representatives, employees, advisers or agents ("Affiliates") for any purpose.
information that you may need. There is no obligation of any kind on easyHotel or its Affiliates to update this presentation. No representation or warranty, express or implied, is or will be made in relation to, and no responsibility or liability is or will be accepted by easyHotel or its Affiliates as to, or in relation to, the accuracy, reliability, or completeness of any information contained in this presentation and easyHotel (for itself and on behalf of its Affiliates) hereby expressly disclaims any and all responsibility or liability (other than in respect of a fraudulent misrepresentation) for the accuracy, reliability and completeness of such information.
prejudice to the generality of the foregoing, no representation or warranty is given as to the achievability or reasonableness or any projection of the future, budgets, forecasts, management targets or estimates, prospects or returns. You should not do anything (including entry into any transaction of any kind) or forebear to do anything on the basis of this presentation. Before entering into any arrangement, commitment or transaction you should take steps to ensure that you understand the arrangement, commitment or transaction and have made an independent assessment of the appropriateness of the arrangement, commitment or transaction in light
contract.
contrary to law or regulation or which would require any registration or licensing within such jurisdiction.
are subject to change without notice.
easyHotel plc
p3
Chief Executive Officer
easyHotel plc
p4
Highlights
Experienced management team delivering growth strategy
Owned hotels: Liverpool, Manchester, Birmingham^, Ipswich*, Barcelona* Placing to raise up to £30m
HY2016 vs. HY2015
increase for owned hotels
increase Strong development pipeline: Franchise hotels: Brussels, Amsterdam, Dubai
^ Acquisition to be completed * Subject to planning permission
1,880 rooms 21 Hotels 14 Cities 9 Countries
easyHotel plc
p5
Chief Financial Officer
easyHotel plc
p6
Financial Summary for Half Year Ending 31 March 2016
This excludes South Africa one-off fee
15%
* 2015 amounts exclude the £0.27m one-off termination fee of a South African franchisee agreement
easyHotel plc
p7
YTD March 2016 YTD March 2015 Change £’000 £’000 % Revenue 2,589 2,319 11.6 Gross profit 1,671 1,485 12.5 Gross profit margin 64.6% 64.0% 0.6pt Central costs (1,096) (966) 13.4 Adjusted EBITDA 575 519 10.9 Depreciation and amortisation (224) (179) 25.1 Interest (29) (36) (19.4) Profit before tax before one-offs 322 304 5.9
Profit Before Tax Before One-Offs
This excludes South Africa one-off fee
15%
Gross profit up
12.5%
Profit before tax before one-
Central staff costs on budget at £0.70m (2015:£0.57m)
easyHotel plc
p8
*One-offs South African one off
Pre-opening costs (Liverpool) (49)
(133) (3) Foreign exchange loss (Benelux franchisee)
Total (182) 62 YTD March 2016 YTD March 2015 £’000 £’000 Profit before tax before one-offs 322 304 One-offs* (182) 62 Profit before tax 140 366 Taxation (57) (122) Profit for the period 83 244
Profit After Tax and One-Offs
This excludes South Africa one-off fee
15%
easyHotel plc
p9
YTD March 2016 YTD March 2015 Growth £’000 £’000 % Owned Hotel Revenue 2,022 1,705 18.6 Profit before tax 814 674 20.8
Owned Hotel Performance
This excludes South Africa one-off fee
15%
18.6%
Total Revenue L4L Revenue
8.0%
Profit before tax
20.8%
Weighted-average* RevPAR growth
+9.9%
RevPAR
£25.40
*Weighted by room number
ROCE on existing hotels
>15% £25.4
easyHotel plc
p10
related to Benelux franchisee
franchise and development agreement negotiations
YTD March 2016 YTD March 2015 Growth £’000 £’000 % Franchised Hotel Revenue 567 884 (35.9) Profit before tax 317 449 (29.4)
Franchise Hotel Performance
This excludes South Africa one-off fee
15%
easyHotel plc
p11 YTD March 2016 YTD March 2015 £’000 £’000 Adjusted EBITDA 575 519 One-offs (excl. non-cash LTIP/SBP cost) (58) 65 Working capital (748) (14) Net cash generated from operations (231) 570 Net cash used in investing activities* (4,590) (861) Net cash generated from/(utilised by) financing activities (203) (962) Net increase/(decrease) in cash and cash equivalents (5,024) (1,253) Cash and cash equivalents at the beginning of the period 22,636 24,264 Exchange differences on translation of foreign operations 2
17,614 23,011
Liverpool
£0.3m
Birmingham
£0.2m
Manchester
£3.3m
Barcelona
£0.8m
£4.6m
Cash Flow Analysis
This excludes South Africa one-off fee
15%
*Investment activity breakdown:
easyHotel plc
p12
for a € denominated facility at 50-60% Loan To Cost
Financing
easyHotel plc
p13
the franchised Brussels, Amsterdam and Bur Dubai hotels
Current Trading and Prospects
* STR Global
p14
Chief Executive Officer
easyHotel plc
p15
Total hotel market estimated at* : Share 2014 2020 2030 2014 2020 2030 (000) rms rms rms % % % Branded Budget 137 180 215 19% 23% 25% All Other 602 600 635 81% 77% 75% UK Market 739 780 850 100% 100% 100%
Opportunity
* Melvin Gold Consulting 2015
easyHotel plc
p16
easyHotel Strategy
Owned Hotel Development
deliver projects on time and on budget
Franchise Hotel Roll-Out
Professionalising The Business
£6-8k EBITDA* per room Total investment cost = 6.5-7.5x EBITDA* £600-800 fee* per room High incremental margin Increasing brand presence without capital investment Marketing budget contribution
^ Board will assess sites with returns below 15% in locations which offer superior risk adjusted returns in the longer term * Target at maturity
Maximise revenue Minimise costs Repeat guests
Driving EBITDA returns
easyHotel plc
p17
Operational Improvement
to market outperformance
bookings
increasing web visits and conversion
5 10 15 20 Oct 2015 Nov 2015 Dec 2015 Jan 2016 Feb 2016 Mar 2016 Percentage Points
Monthly RevPAR performance versus market (mature* hotels) Source STR Global
* Old Street and Glasgow owned hotels
easyHotel plc
p18
Deals Secured: 278 rooms
Q2 2017 Q3 2017
Birmingham
Liverpool
Manchester
easyHotel plc
p19
Planning Permission Submitted: a further 298 rooms
easyHotel Ipswich
94 rooms Refurbishment to start when planning permission is granted Opening by June 2017
easyHotel Barcelona
204 rooms Planning submitted in April 2016, pending approval Opening early 2018
Q3 2017 Q4 2017 Q1 2018 Q2 2018
Ipswich
Barcelona
We continue to review a number of potential acquisitions
easyHotel plc
p20
Committed Franchise Projects: >500 rooms
easyHotel Amsterdam 131 rooms Under construction Opening end 2016 easyHotel Brussels 107 rooms Under construction Opening end 2016 easyHotel Bur Dubai 300 rooms Planning obtained Opening end 2017
Potential future franchised projects > 1,000 rooms
easyHotel plc
p21
Summary Strategy implementation on track Positive trading continues Over 1,000 rooms committed to deliver enhanced financial returns and board considering funding
easyHotel plc
p22
easyHotel plc
p23
Appendix A: Statement of Comprehensive Income
YTD March 2016 YTD March 2015 30 September 2015 £’000 £’000 £’000 System sales 9,663 9,021 19,951 Revenue 2,589 2,589 5,541 Cost of sales (967) (834) (1,729) Gross profit 1,622 1,755 3,812 Administrative expenses (1,453) (1,148) (2,882) Analysed as: Adjusted EBITDA 575 519 1,457 Pre-opening costs (49)
Restructuring
South African one off
270 SBP/LTIP and other expenses (133) (3) (32) Depreciation and amortisation (224) (179) (387) 169 607 930 Profit from operations 169 607 930 Net finance (costs)/income (29) (241)* (143) Profit before taxation 140 366 787 Taxation (57) (122) (178) Profit for the period 83 244 609
* Including £205k unrealised foreign exchange loss on amounts due from Benelux franchisee
easyHotel plc
p24
Appendix B: Balance Sheet
YTD March 2016 YTD March 2015 30 September 2015 £’000 £’000 £’000 Non-Current Assets Intangible assets 84 60 67 Property, plant and equipment 25,339 19,418 20,951 Total non-current assets 25,423 19,478 21,018 Current Assets Trade and other receivables 365 781 360 Cash and cash equivalents 17,614 23,011 22,636 Corporate taxation
Total current assets 17,979 23,792 23,003 Total assets 43,402 43,270 44,021 Non-Current Liabilities Trade and other payables 139 167 145 Deferred tax liability 142 94 128 Bank borrowings
7,200 Total non-current liabilities 281 7,461 7,473 Current Liabilities Trade and other payables 3,396 3,593 4,106 Corporation taxation 37 167
7,200
10,633 3,760 4,106 Total liabilities 10,914 11,221 11,579 Total net assets 32,488 32,049 32,442 Equity Share capital 625 625 625 Share premium 28,592 28,592 28,592 Merger reserve 2,750 2,750 2,750 EBT reserve (1,067) (1,067) (1,067) Currency translation reserve 41
1,547 1,149 1,542 Total equity 32,488 32,049 32,442
easyHotel plc
p25
Appendix C: Cash Flow Statement
YTD March 2016 YTD March 2015 30 September 2015 Cash flows from operating activities £’000 £’000 £’000 Profit before taxation for the year 140 366 787 Adjustments for: Depreciation of property, plant and equipment 224 179 387 Share based payments 124 2 30 Finance income (80) (38) (187) Finance expense 109 279 330 Operating cash flows before movement in working capital 517 788 1,347 Decrease/(increase) in trade and other receivables (4) 140 563 (Decrease)/increase in trade and other payables (716) (92) 382 Cash generated from operations (202) 836 2,292 Corporate tax paid
(222) Net cash flows from operating activities (202) 811 2,070 Finance income 80 38 187 Finance expense (109) (279) (151) Net cash generated from operations (231) 570 2,106 Investing activities Purchase of property, plant and equipment (4,590) (861) (2,593) Net cash used in investing activities (4,590) (861) (2,593) Financing activities Outflow from own share purchase
(962) Dividend paid (203)
Net cash generated from/(utilised by) financing activities (203) (962) (1,141) Net increase/(decrease) in cash and cash equivalents (5,024) (1,253) (1,628) Cash and cash equivalents at the beginning of the period 22,636 24,264 24,264 Exchange differences on translation of foreign operations 2
17,614 23,011 22,636